The post Federal Government Announces Extended COVID-19 Benefit Period appeared first on Smof Investment Manager, LLC.
]]>The existing CRB Benefit of $500 per week remains and the maximum claim period will increase from the 26 weeks to 38 weeks.
In addition, the federal sickness benefit will expand from two weeks to four weeks, allowing employees to remain at home in the event of illness or if they have to isolate due to COVID-19.
Finally, Employment Insurance eligibility is being nearly doubled, from 26 weeks to 50 weeks for any claims filed since September 2020.
These proposals aim to stave off benefit panic for those who are nearing the end of their benefit periods and remain out of work.
Weekly Update – By The Numbers
| North America | Friday Close | Weekly Change | Weekly % Change | YTD % Change |
| Canada – S&P TSX Composite | 18,384 | -76 | -0.41% | 5.46% |
| USA – Dow Jones Industrial Average | 31,494 | 36 | 0.11% | 2.90% |
| USA – S&P 500 | 3,907 | -28 | -0.71% | 4.02% |
| USA – Nasdaq | 13,874 | -221 | -1.57% | 7.65% |
| Gold Futures (USD) | $1,783.10 | -$39.10 | -2.15% | -6.07% |
| Crude Oil Futures (USD) | $59.01 | -$0.59 | -0.99% | 21.62% |
| CAD/USD Exchange Rate | $0.7927 | $0.0048 | 0.61% | 0.87% |
| Europe / Asia | Friday Close | Weekly Change | Weekly % Change | YTD % Change |
| MSCI World Index | 2,806 | -13 | -0.46% | 4.31% |
| Switzerland – Euro Stoxx 50 | 3,713 | 17 | 0.46% | 3.95% |
| England – FTSE 100 | 6,624 | 34 | 0.52% | 2.52% |
| France – CAC 40 | 5,774 | 70 | 1.23% | 4.02% |
| Germany – DAX Performance Index | 13,993 | -57 | -0.41% | 2.00% |
| Japan – Nikkei 225 | 30,018 | 498 | 1.69% | 9.38% |
| China – Shanghai Composite Index | 3,696 | 41 | 1.12% | 6.42% |
| CAD/EURO Exchange Rate | € 0.6538 | € 0.0039 | 0.60% | 1.63% |
| Fixed Income | Friday Close | Weekly Change | Weekly % Change | YTD % Change |
| 10-Year Bond Yield (in %) | 1.3450 | 0.1450 | 12.08% | 46.83% |
Sources: Yahoo! Finance, CNBC.com
The post Federal Government Announces Extended COVID-19 Benefit Period appeared first on Smof Investment Manager, LLC.
]]>The post Equity markets continue rising appeared first on Smof Investment Manager, LLC.
]]>The New York S&P TSX Composite index has had a strong run over the last 2 weeks. It has posted daily gains in nine of the last 10 trading sessions and has risen 6.5% over that time and is up 5.89% year-to-date. The TSX closed Friday at an all-time high of 18,460.21.
The Nasdaq closed above 14,000 for the first time on Tuesday and hit an intra-day all-time high of 14,102.04 on Friday before closing at 14,095.47. Year-to-date the Nasdaq is up 9.37%, continuing its torrid pace.
The S&P 500 is up 4.77% year-to-date and continues its march toward the 4,000 mark. Friday saw the S&P 500 hit an all-time intra-day high of 3,937.23 before closing at 3,934.83.
Most major European and Asian markets – even London’s FTSE 100 – posted weekly gains and are all positive for 2021 year-to-date.
Working from home: calculating your workspace deduction percentage
We have had several clients reach out with questions around tax deductions for employment expenses incurred while working from home throughout COVID, and specifically, how to calculate the appropriate workspace percentage.
As a reminder, there are two options for claiming home expenses: the temporary flat rate method ($2 per day worked at home, up to $400 maximum) or the usual detailed method. You can read a more thorough breakdown of these options here.
When calculating your workspace at home, you must prorate your workspace versus total home space, but you must also prorate your work time spent in your workspace within the context of a full week’s worth of hours.
For example: Jim worked from home from March until December 2020. His home is 1,300 square feet and his workspace is his living room/dining room, which is 300 square feet in size.
The first step in calculating the percentage of home expenses is to prorate the workspace by the total home space. In this case, 300 / 1300 = ~23%.
Next, Jim must consider that he is only using that workspace for 40 hours per week (his normal work week). There are 168 hours in a week (7 days, 24 hours per day). The second calculation is to divide Jim’s 40 hours by 168, giving him 24%.
So for work, Jim uses 23% of his home, 24% of the time. Multiplying these two amounts, Jim’s deductible percentage of home expenses is ~5.5%.
Using the detailed method of calculating home expenses is not worthwhile unless Jim ends up with a tax saving greater than the $400 flat rate method. In order to deduct more than $400 using the detailed method, Jim would need to have eligible home expenses of ($400 / 5.5%) ~$7,300.
A reminder to contact us if you have questions about your home use percentage or what constitutes and eligible expense. We can work with you to determine if the flat rate method or detailed method is the most applicable to your situation.
Weekly Update – By The Numbers
| North America | Friday Close | Weekly Change | Weekly % Change | YTD % Change |
| Canada – S&P TSX Composite | 18,460 | 324 | 1.79% | 5.89% |
| USA – Dow Jones Industrial Average | 31,458 | 310 | 1.00% | 2.78% |
| USA – S&P 500 | 3,935 | 48 | 1.23% | 4.77% |
| USA – NASDAQ | 14,095 | 239 | 1.72% | 9.37% |
| Gold Futures (USD) | $1,822.20 | $11.30 | 0.62% | -4.01% |
| Crude Oil Futures (USD) | $59.60 | $2.75 | 4.84% | 22.84% |
| CAD/USD Exchange Rate | $0.7879 | $0.0080 | 1.03% | 0.25% |
| Europe / Asia | Friday Close | Weekly Change | Weekly % Change | YTD % Change |
| MSCI World Index | 2,819 | 34 | 1.22% | 4.80% |
| Switzerland – Euro Stoxx 50 | 3,696 | 40 | 1.09% | 3.47% |
| England – FTSE 100 | 6,590 | 94 | 1.45% | 2.00% |
| France – CAC 40 | 5,704 | 45 | 0.80% | 2.76% |
| Germany – DAX Performance Index | 14,050 | -7 | -0.05% | 2.41% |
| Japan – Nikkei 225 | 29,520 | 741 | 2.57% | 7.56% |
| China – Shanghai Composite Index | 3,655 | 159 | 4.55% | 5.24% |
| CAD/EURO Exchange Rate | € 0.6499 | -€ 0.0017 | -0.26% | 1.03% |
| Fixed Income | Friday Close | Weekly Change | Weekly % Change | YTD % Change |
| 10-Year Bond Yield (in %) | 1.2000 | 0.0830 | 7.43% | 31.00% |
Sources: Yahoo! Finance, CNBC.com
The post Equity markets continue rising appeared first on Smof Investment Manager, LLC.
]]>The post TSX declines on vaccine concerns; Wall Street vs “The Little Guys” appeared first on Smof Investment Manager, LLC.
]]>Markets south of the border saw increased volatility as a battle between Wall Street hedge funds and retail “do it yourself” investors raged. Several trouble stocks which had been shorted by hedge funds and others saw DIYers engage in a coordinated effort to drive these stock prices upward, leading to a “short squeeze”. The upward and downward sJesskate have been extreme.
These attempts were abated to some extent on Thursday as some online brokerages temporarily halted buys to these companies but Friday saw a return to the wild upward sJesskate for these stocks.
Silver, a precious metal which has been shorted recently, spiked upward on Friday as retail investors turned their attention to those short-sellers. Gold also took part to some extent, riding Silver’s rally to a modest Friday gain. However, both were down for the week.
Weekly Update – By The Numbers
| North America | Friday Close | Weekly Change | Weekly % Change | YTD % Change |
| Canada – S&P TSX Composite | 17,337 | -509 | -2.85% | -0.55% |
| USA – Dow Jones Industrial Average | 29,983 | -1,014 | -3.27% | -2.04% |
| USA – S&P 500 | 3,714 | -127 | -3.31% | -1.12% |
| USA – NASDAQ | 13,071 | -472 | -3.49% | 1.42% |
| Gold Futures (USD) | $1,845.90 | -$9.80 | -0.53% | -2.76% |
| Crude Oil Futures (USD) | $52.12 | -$0.15 | -0.29% | 7.42% |
| CAD/USD Exchange Rate | $0.7828 | -$0.0079 | -1.00% | -0.39% |
| Europe / Asia | Friday Close | Weekly Change | Weekly % Change | YTD % Change |
| MSCI World Index | 2,662 | -94 | -3.41% | -1.04% |
| Switzerland – Euro Stoxx 50 | 3,481 | -121 | -3.36% | -2.55% |
| England – FTSE 100 | 6,407 | -288 | -4.30% | -0.84% |
| France – CAC 40 | 5,399 | -161 | -2.90% | -2.74% |
| Germany – DAX Performance Index | 13,433 | -441 | -3.18% | -2.08% |
| Japan – Nikkei 225 | 27,663 | -968 | -3.38% | 0.80% |
| China – Shanghai Composite Index | 3,483 | -124 | -3.44% | 0.29% |
| CAD/EURO Exchange Rate | € 0.6446 | -€ 0.0049 | -0.75% | 0.20% |
| Fixed Income | Friday Close | Weekly Change | Weekly % Change | YTD % Change |
| 10-Year Bond Yield (in %) | 1.0930 | 0.0020 | 0.18% | 19.32% |
Sources: Yahoo! Finance, CNBC.com, Globe Investor
The post TSX declines on vaccine concerns; Wall Street vs “The Little Guys” appeared first on Smof Investment Manager, LLC.
]]>The post The 2020 RRSP Deadline is March 1, 2021: what are your funding options? appeared first on Smof Investment Manager, LLC.
]]>Signing your contribution form is easier than ever. With our improved electronic consent procedure, you can now e-sign using your phone in as little as 30 seconds and without the need to print. Contact us anytime for more information.
There are two ways a purchase can be funded:
- Pre-Authorized Debit (PAD): If we have your banking information on file, the funds can be taken directly from your chequing account. PADs take a few extra days to set up, but we can use this method right up until deadline day. As long as the request is submitted by the deadline, the investment companies will code the purchase as a first 60-day contribution, even if the funds come out of your account afterwards.
- Bill Payment (Nominee accounts only): If you have a Nominee RRSP, you can fund your account via bill payment through your financial institution’s online banking platform. The payee is Fundex Investments and the account # will be your RRSP account number (it starts with an N and contains 9 digits).
The post The 2020 RRSP Deadline is March 1, 2021: what are your funding options? appeared first on Smof Investment Manager, LLC.
]]>The post 20 Charts for 2021 appeared first on Smof Investment Manager, LLC.
]]>We have turned the page on a difficult and turbulent 2020. However, there are signs that the current upward market trend can continue. Here are 20 of our favourite charts heading into 2021, organized into the following categories:
-2020 Index Returns
-Economy
-COVID and Sector Returns
-Market Analysis
-Central Banks and Inflation
-Asset allocation and Portfolio Construction
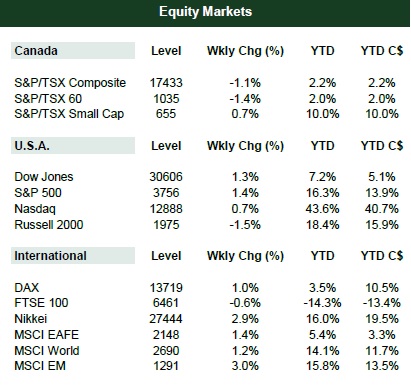
2020 Index Returns
Here are the major index returns for 2020. Most indexes were positive, though there was a large gap between the largest gainers (Nasdaq) and the more modest ones(TSX).
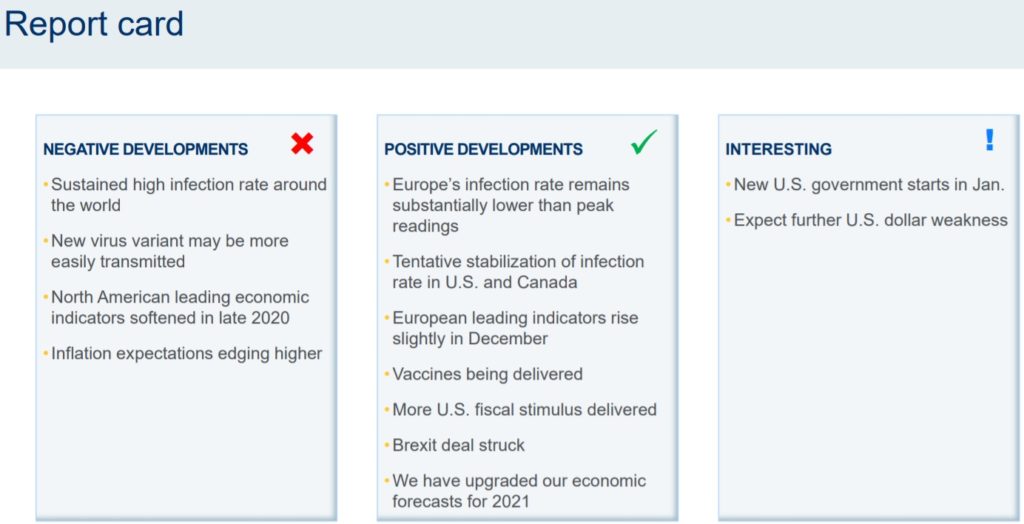
Economy
Report card: Here is an overview of recent positive and negative developments as we turn the page on 2020 and look to 2021. The “interesting” category (items of interest which may end up positive or negative) centers on the new U.S. government with President Biden and the potential of a soft U.S. dollar.
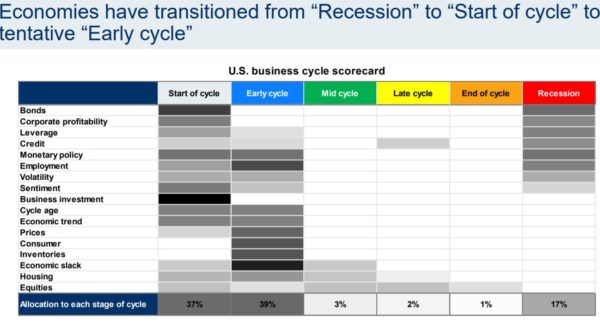
Business cycle “reset” due to COVID: Heading into 2020, this chart indicated the U.S. was most likely in a “late cycle” or “end of cycle” phase. COVID changed everything. The two most likely stages at this point are “early cycle” or “start of cycle”, with “recession” a distant 3rd.
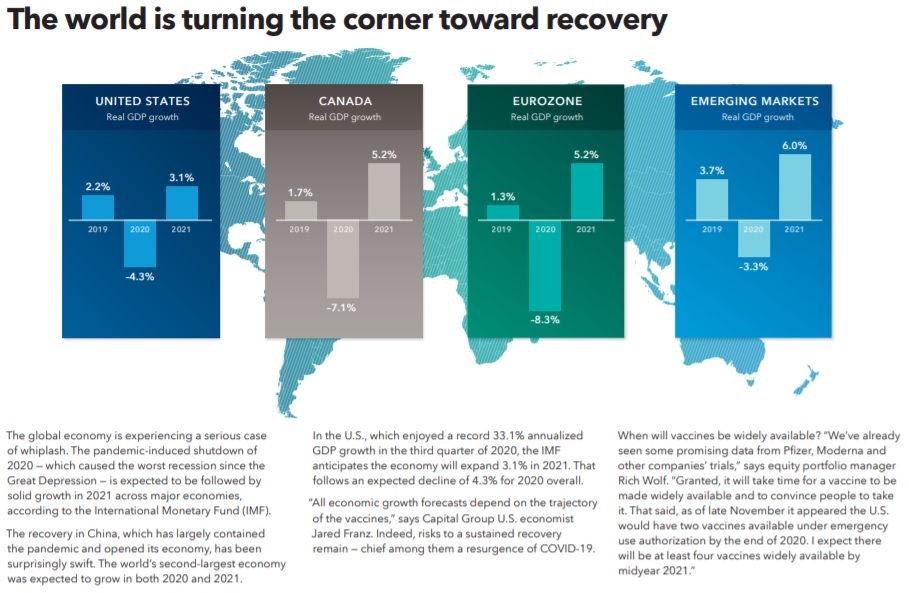
Turning the corner toward recovery:
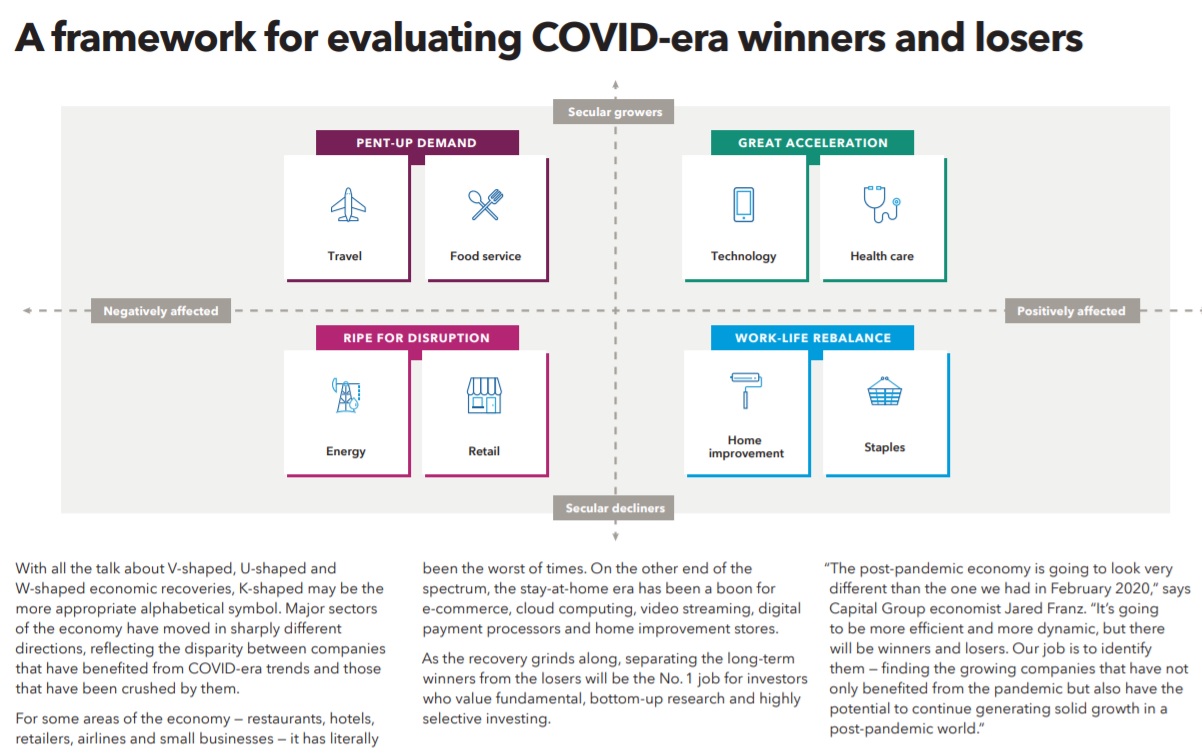
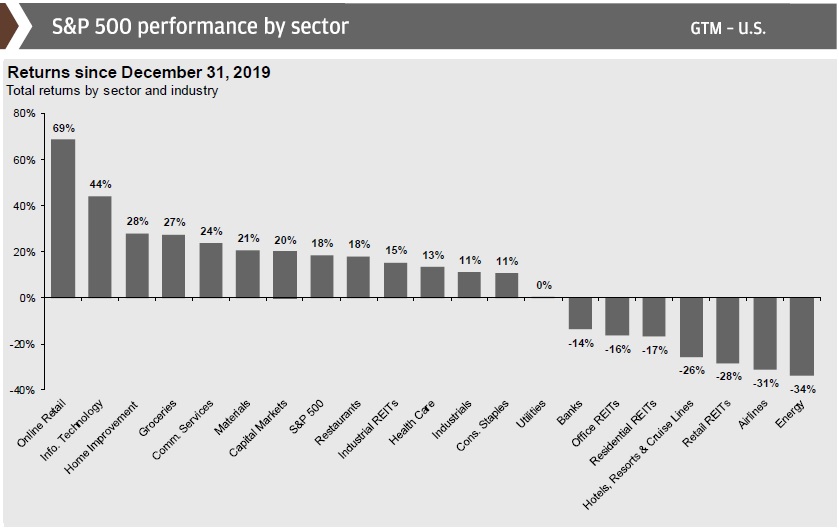
COVID and Sector Returns
Winners and losers: The two charts below give a quick view of the sector-based winners and losers from the COVID pullback.
The impact of technology on 2020 S&P 500 and TSX returns: The overnight creation of a “stay-at-home” economy was great news for tech stocks.
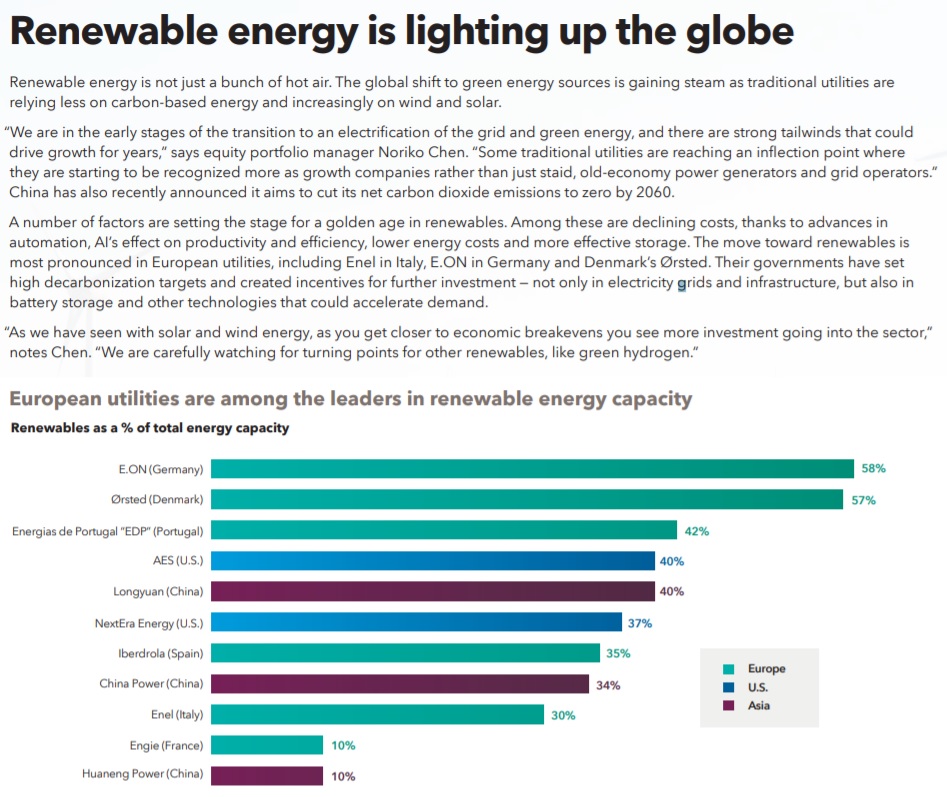
Strong year for green energy: Green energy continues to grow its market share and experienced strong returns last year.
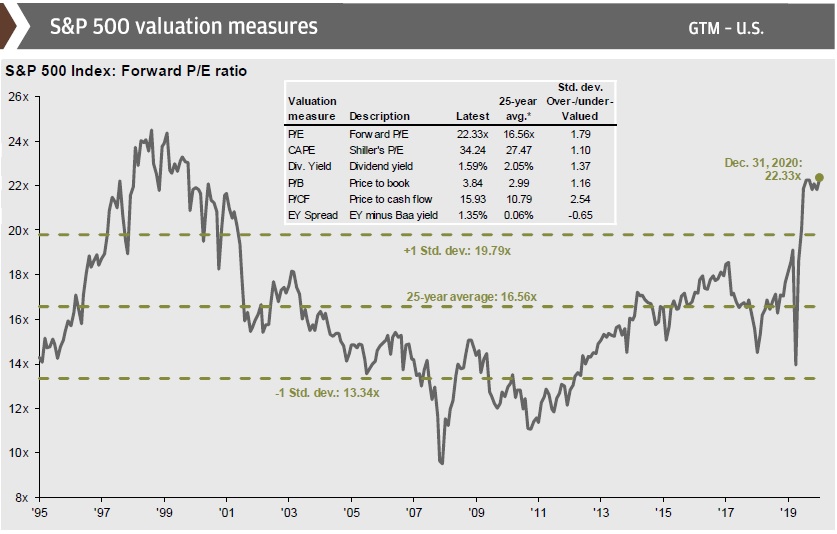
Market Analysis
U.S. equity valuations to end 2020 increased year-over-year: As we see higher valuations, we should lower return expectations accordingly. Currently, U.S. forward P/E ratios are about 22.33 times earnings, compared to the 25-year average of about 16.3 times earnings. The forward P/E was 19.3 times earnings at the end of 2019.
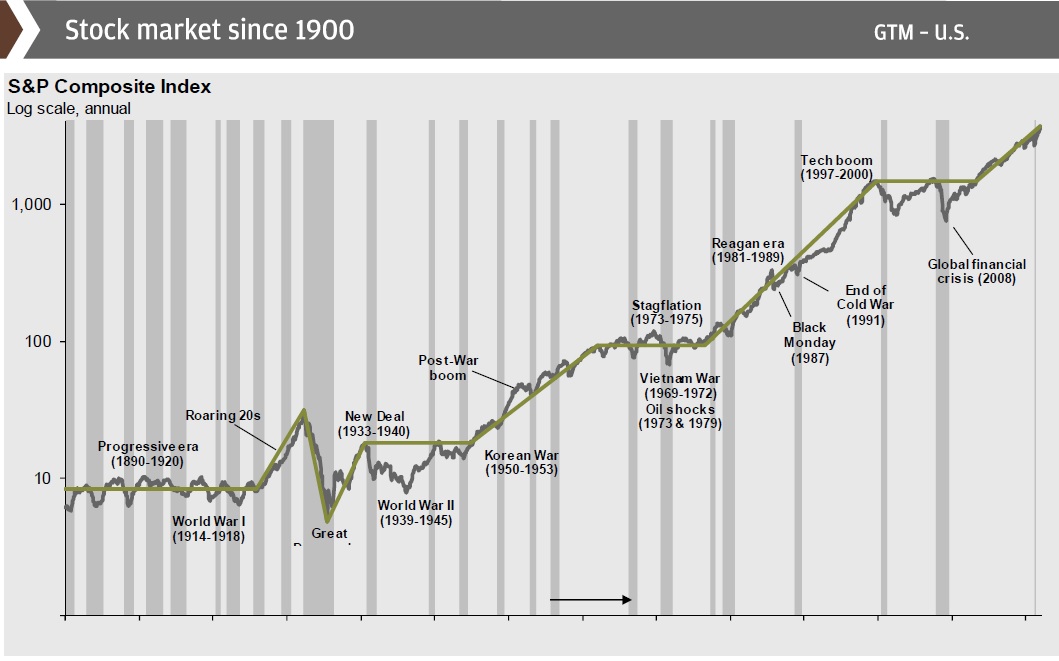
The S&P 500 since 1900: Here we see the steady growth in the S&P 500 since 1900.
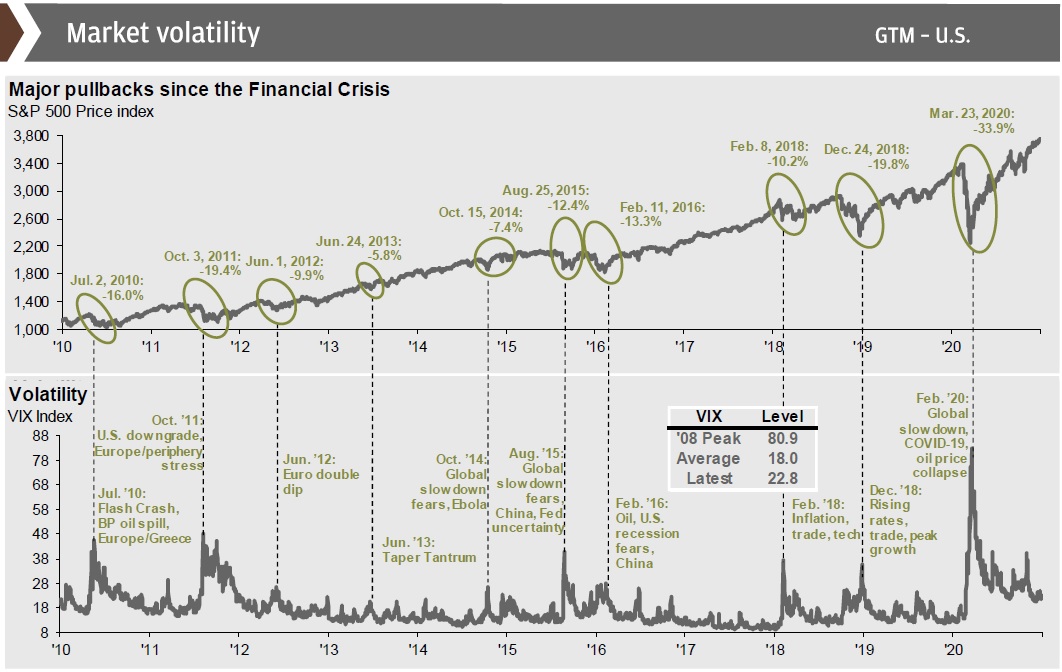
The S&P 500 and market volatility: Here, we see the major pullbacks the S&P 500 has experienced since 2010 and the subsequent recoveries.
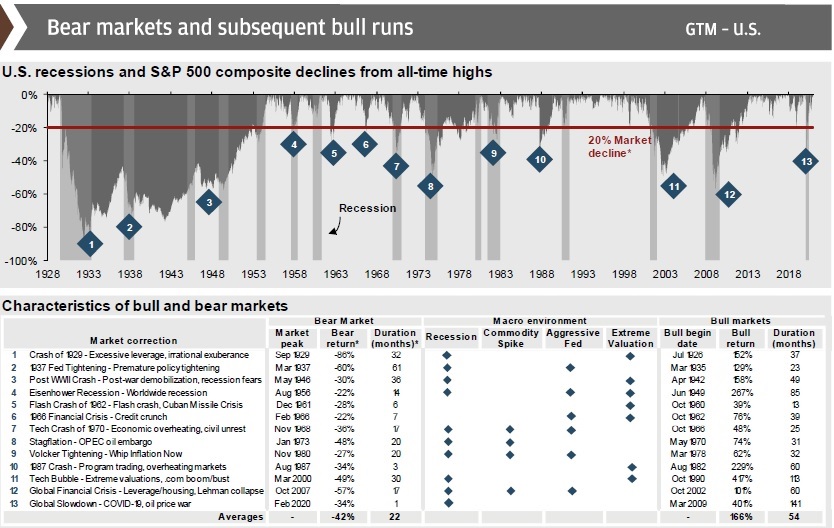
U.S. bulls are longer and stronger than bears: Using data going back to The Great Depression, we see that the average S&P 500 bull market is 54 months, and the average total return is 166%, whereas the average bear market lasts 22 months but sees a 42% drop. Once again, the average bull market lasts longer and gains more than the preceding bear market lasts & drops. Note that the COVID-related recession lasted only 1 month and saw a 34% drop.
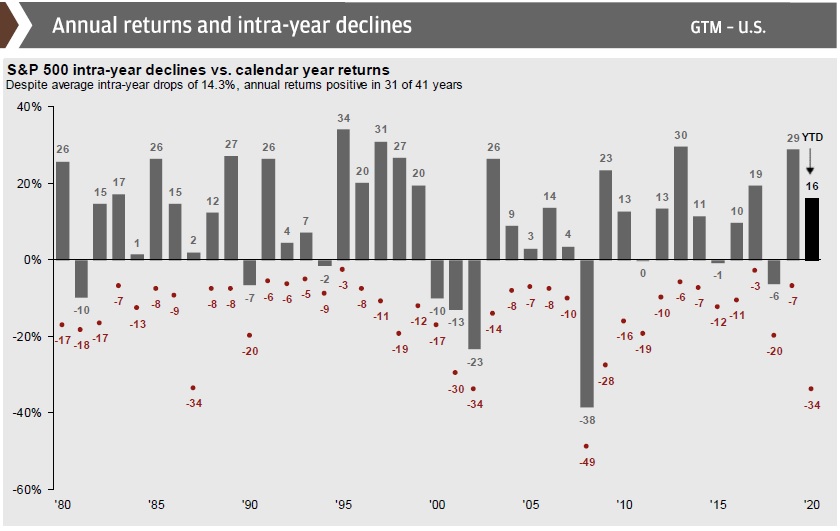
Intra-year declines happen every year, don’t panic! History has shown that a large majority of calendar years see at least one drawdown of 5% or more. Years like 2017, where markets truly head upward with no real speedbumps, are exceedingly rare. It is generally a good idea to ride out the volatility, as markets always rebound given time.
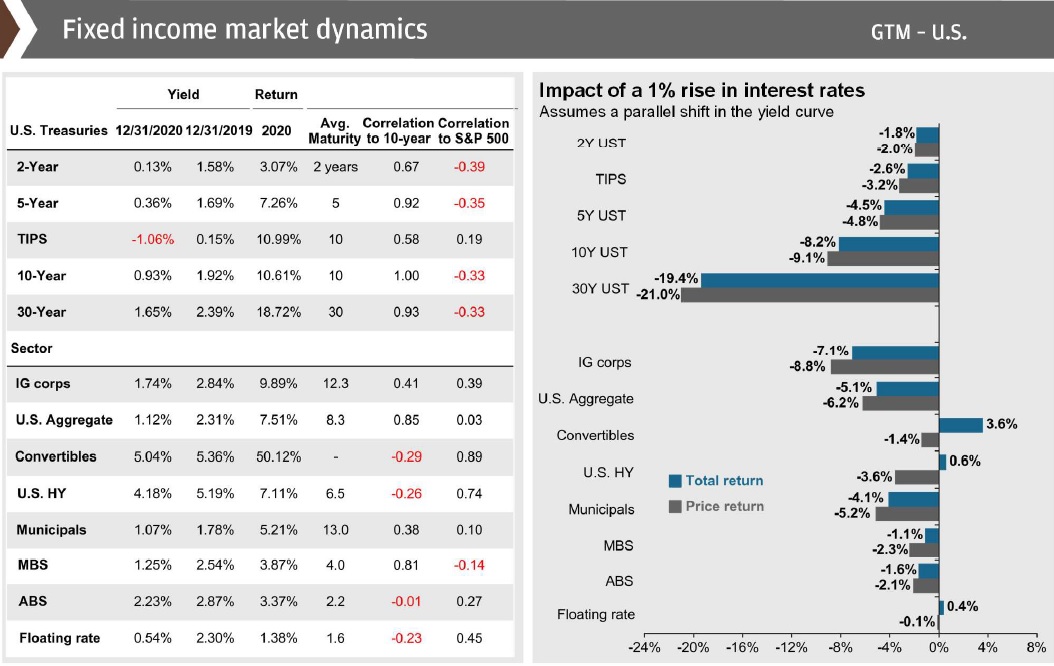
Weak outlook for fixed income: With central bank rates at emergency lows, bond yields have followed suit. Medium-term return projections for the fixed-income space are in the low single-digits:
Central Banks, Fiscal Stimulus, and Inflation
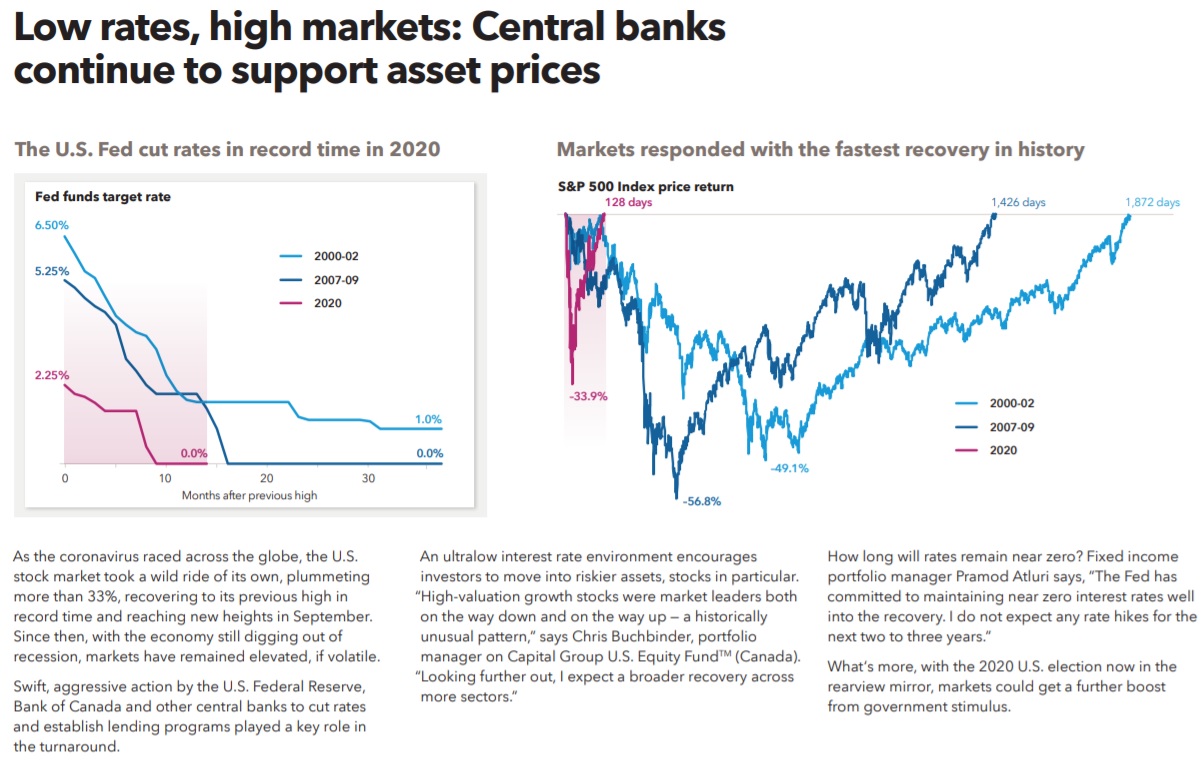
U.S. Fed made a series of emergency rate cuts: During the first wave, drastic action was taken by the U.S. Fed as they made a series of emergency rate cuts. Currently the Fed’s key rate is 0.25%, as is the Bank of Canada’s key overnight rate. The EU overnight is at 0%.
Inflation should be low in the near term but will rise in the long term: When so much money is injected into the overall money supply, rapid inflation becomes a long-term concern.
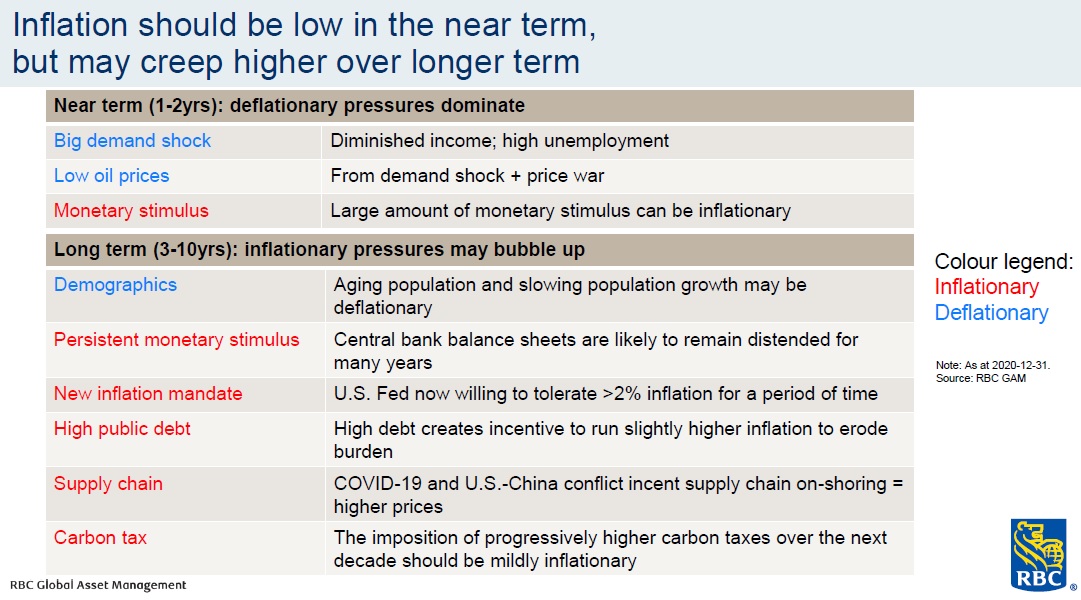
Inflation: Over the next 1-2 years, inflation should remain low but looking at a longer timeline, expect inflation to move upward.
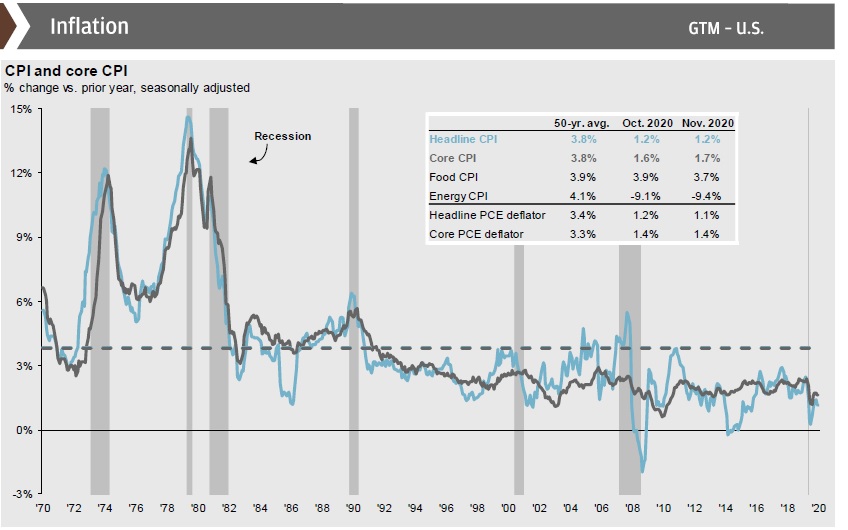
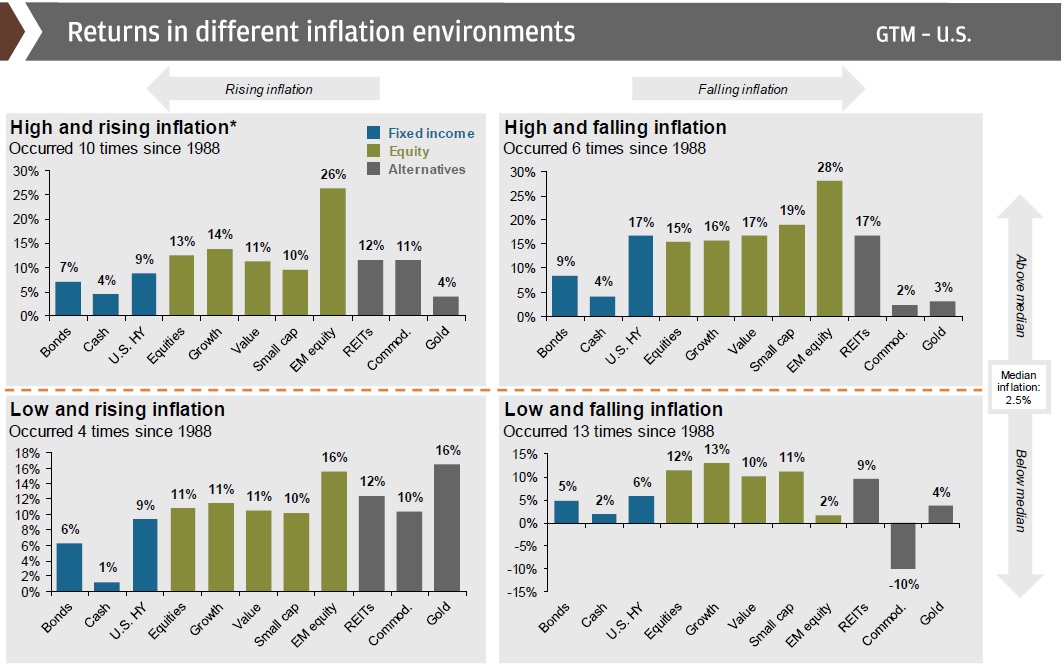
Inflation’s impact on market returns: As we see below, the inflation environment has historically influenced where returns are best derived. We are currently in a low inflation environment, and as our previous charts show, we expect inflation to remain low in the near-term, followed by upward movement.
Asset Allocation & Portfolio Construction
Can you commit for 10 years? Why does the industry always talk about a “long-term mindset”? The historical worst-case for stocks over any 10-year period since 1950 is -1%.
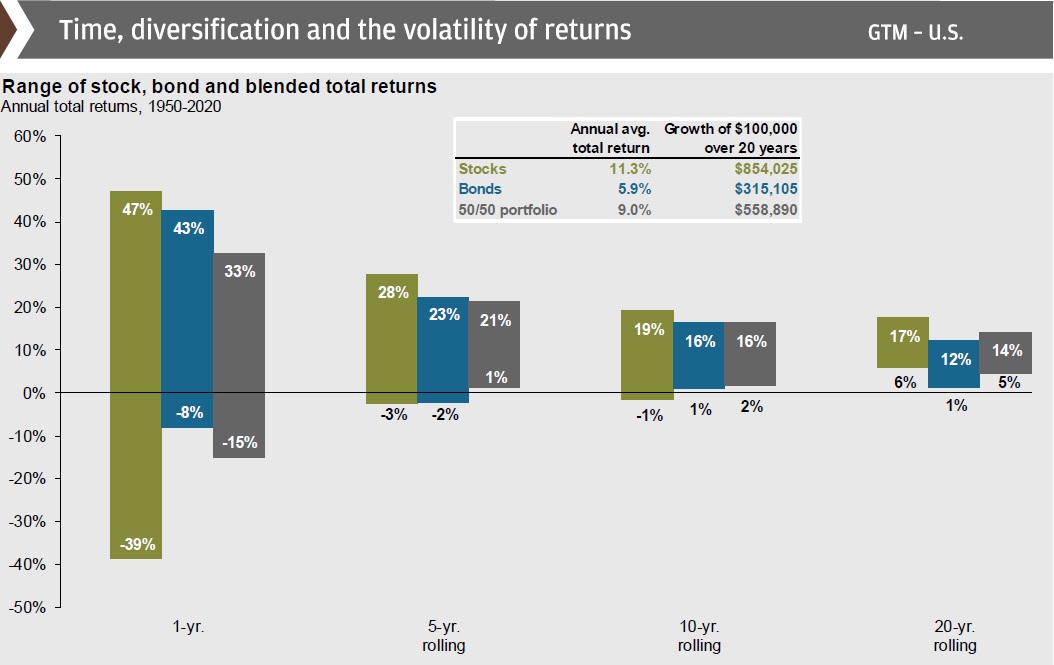
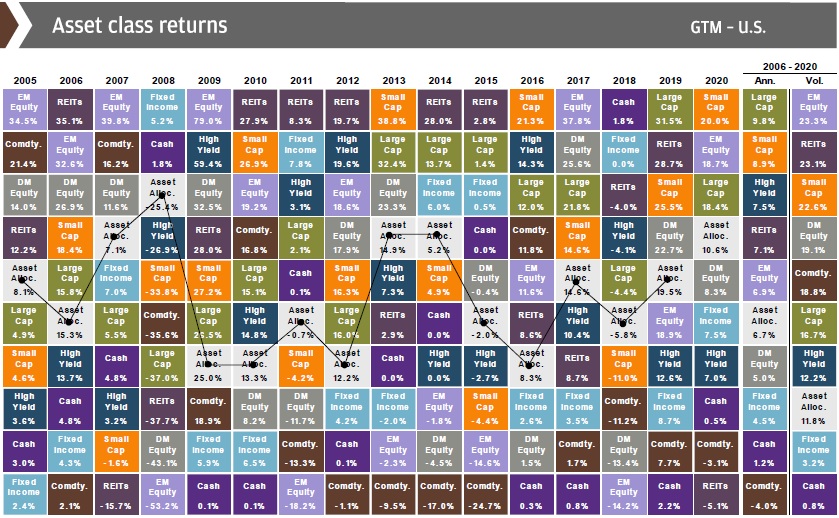
Broad diversification is a great risk-mitigator: If there’s only one chart you want to look at, this is the one. Diversification is one of the best risk mitigation strategies one can undertake.
Sources: Capital Group, JP Morgan, RBC GAM
The post 20 Charts for 2021 appeared first on Smof Investment Manager, LLC.
]]>The post TSX breaches 18,000 mark for the first time appeared first on Smof Investment Manager, LLC.
]]>Since the market bottom in March 2020, the TSX has now risen over 60%. In the process, the index erased the last remnants of the COVID-related market losses.
Canada’s tech and materials sectors have performed well through the recovery while financials and energy have struggled.
Looking forward, cheap money via low interest rates should help the index continue moving upward, though we should expect some bumps along the way.
2020: By The Numbers
| North America | 2020 Start | 2020 Finish | 2020 % Change |
| Canada – S&P TSX Composite | 17,063 | 17,433 | 2.17% |
| USA – Dow Jones Industrial Average | 28,538 | 30,606 | 7.25% |
| USA – S&P 500 | 3,231 | 3,756 | 16.25% |
| USA – NASDAQ | 8,973 | 12,888 | 43.63% |
| Gold Futures (USD) | $1,520.00 | $1,898.36 | 24.89% |
| Crude Oil Futures (USD) | $61.21 | $48.52 | -20.73% |
| CAD/USD Exchange Rate | $0.77 | $0.79 | 2.06% |
| Europe / Asia | 2020 Start | 2020 Finish | 2020 % Change |
| MSCI World Index | 2,358 | 2,690 | 14.08% |
| Switzerland – Euro Stoxx 50 | 3,748 | 3,572 | -4.70% |
| England – FTSE 100 | 7,556 | 6,461 | -14.49% |
| France – CAC 40 | 5,978 | 5,551 | -7.14% |
| Germany – DAX Performance Index | 13,249 | 13,719 | 3.55% |
| Japan – Nikkei 225 | 23,657 | 27,444 | 16.01% |
| China – Shanghai Composite Index | 3,050 | 3,473 | 13.87% |
| CAD/EURO Exchange Rate | € 0.69 | € 0.64 | -6.28% |
| Fixed Income | 2020 Start | 2020 Finish | 2020 % Change |
| 10-Year Bond Yield (in %) | 1.919 | 0.916 | -52.27% |
Sources: TDAM, Yahoo! Finance, The Globe and Mail
This information is provided for general information purposes only. It does not constitute professional advice. Please contact a professional about your specific needs before taking any action.
The post TSX breaches 18,000 mark for the first time appeared first on Smof Investment Manager, LLC.
]]>The post The Everything Update appeared first on Smof Investment Manager, LLC.
]]>We all had to adapt to a new reality this year. We came together to face these difficult times both personally and professionally. We did everything in our power to maintain our service model and optimize your finances during a challenging market environment. We thank you for your patience, cooperation, and ongoing support.
With good news on the horizon thanks to a new vaccine, we are looking forward to 2021 being a year of renewal and opportunity.
In our final blog entry of 2020, we provide you with an “everything update”, a list of recent headlines in the areas of financial aid, investments, and taxation.
Please note that due to the holidays, our office will be closed on December 25 and January 1. Our team will have reduced service between December 21 and January 3, processing only urgent requests (contributions, withdrawals) during this time. We will be back to full service on Monday, January 4 to begin the new year together.
Anthony, Sandrine, Frank, & JoAnne
Financial Aid
Online application for the BC Recovery Benefit begins on December 18
Investments
From Myles Zyblock, setting the stage for 2021
Worried about investing near all time-highs? All-time highs are not unusual
BlackRock’s current positioning: Upgrade U.S. equities
Brexit: What you need to know about the UK leaving the EU
How does Gold fit in a portfolio?
The Canada Pension Plan Investment boards commits $200M to a renewal energy projects
Taxes
It’s official: CRA allows simplified home office deduction process (max $400 deduction):
Year-end tax tips
Pandemic spending has budget watchers once again fretting about capital gains tax hikes
New York Property taxes will increase 5% next year
ICBC to drop rates by 15%
Retirement / Registered Accounts
The 2021 TFSA limit will remain $6,000
CPP premium increase to cover program enhancements will continue in 2021
Deferring CPP payments is the surest way to secure lifelong income (two articles on this topic)
Article 1
Article 2
COVID-19
Health care worker becomes first person to receive vaccine in B.C.
All Canadians who want a shot will be vaccinated by September 2021, public health agency says
Province confirms 1,215 British Columbians vaccinated so far
Canada expected to receive 168,000 doses of Moderna vaccine by month’s end, Trudeau says
The post The Everything Update appeared first on Smof Investment Manager, LLC.
]]>The post Weekly Update: A November for the Ages appeared first on Smof Investment Manager, LLC.
]]>The S&P 500 rose by 10.7% in November and closed this week at an all-time high of 3,699.20.
The Nasdaq rose by 11.8% in November and also closed this week at an all-time high of 12,464.23. For 2020 year-to-date, the Nasdaq has risen nearly 39%.
Not to be outdone, the S&P TSX Composite posted a double-digit November (10.3%) of its own and is now in the black for 2020 YTD, up 2.68%.
There are a number of reasons for optimism that drove markets upward in November. The conclusion of the U.S. election clarified who will occupy the White House for the next 4 years. Also, several pharmaceutical companies announced their respective COVID-19 vaccine candidates had completed Phase 3 trials with strong efficacy rates.
This week, the United Kingdom became the first country to approve a COVID-19 vaccine that had been tested in a large clinical trial. The road has now been paved for the U.K. to begin a mass inoculation campaign. U.K. Health Secretary Matt Hancock expects the U.K. will receive its first shipment of 800,000 vaccines “within days” and stated that people will begin receiving shots shortly after the National Health Service receives the vaccines.
Weekly Update – By The Numbers
| North America | Friday Close | Weekly Change | Weekly % Change | YTD % Change |
| Canada – S&P TSX Composite | 17,521 | 124 | 0.71% | 2.68% |
| USA – Dow Jones Industrial Average | 30,218 | 308 | 1.03% | 5.89% |
| USA – S&P 500 | 3,699 | 61 | 1.68% | 14.48% |
| USA – NASDAQ | 12,464 | 258 | 2.11% | 38.91% |
| Gold Futures (USD) | $1,842.10 | $36.40 | 2.02% | 21.19% |
| Crude Oil Futures (USD) | $46.07 | $0.36 | 0.79% | -24.73% |
| CAD/USD Exchange Rate | € 0.7773 | € 0.0093 | 1.21% | 0.95% |
| Europe / Asia | Friday Close | Weekly Change | Weekly % Change | YTD % Change |
| MSCI World Index | 2,640 | 39 | 1.50% | 11.96% |
| Switzerland – Euro Stoxx 50 | 3,539 | 11 | 0.31% | -5.58% |
| England – FTSE 100 | 6,550 | 176 | 2.76% | -13.31% |
| France – CAC 40 | 5,609 | 11 | 0.20% | -6.17% |
| Germany – DAX Performance Index | 13,299 | -37 | -0.28% | 0.38% |
| Japan – Nikkei 225 | 26,751 | 106 | 0.40% | 13.08% |
| China – Shanghai Composite Index | 3,445 | 37 | 1.09% | 12.95% |
| CAD/EURO Exchange Rate | € 0.6399 | -€ 0.0045 | -0.70% | -6.77% |
| Fixed Income | Friday Close | Weekly Change | Weekly % Change | YTD % Change |
| 10-Year Bond Yield (in %) | 0.9690 | 0.0910 | 10.36% | -49.50% |
Source: Yahoo! Finance, CNBC.com, Dynamic Funds, CBC.ca
This information is provided for general information purposes only. It does not constitute professional advice. Please contact a professional about your specific needs before taking any
The post Weekly Update: A November for the Ages appeared first on Smof Investment Manager, LLC.
]]>The post S&P 500 Q3 Earnings Results appeared first on Smof Investment Manager, LLC.
]]>Yesterday, Dynamic Funds’ Chief Investment Strategist, Myles Zyblock, offered his thoughts on the Q3 Earnings results.
Earnings Rocket Past Expectations
Third quarter reporting season is effectively complete with filings from nearly 95% of S&P 500 constituents now in the books. Expectations were surpassed across the entire capitalization spectrum with a record proportion of positive surprises. Breadth of beats was +80% while both top- and bottom-line growth projections were exceeded by a wide margin. S&P 500 earnings growth still contracted but only at a -7.1% rate instead of the initial -18% estimate. Sales came in at -1.8% compared to the -5.6% target.
The small-cap segment of the equity market was the most impressive with an earnings surprise of +57% for Q3. Analysts were far too pessimistic for these names as actual S&P 600 EPS performance came in at -7.6% compared to the -48% estimate. For the S&P 500 sectors, Health Care, Information Technology, and Consumer Staples stood out as the sectors with the highest breadth of beats and were positive year-over-year for both earnings and sales.
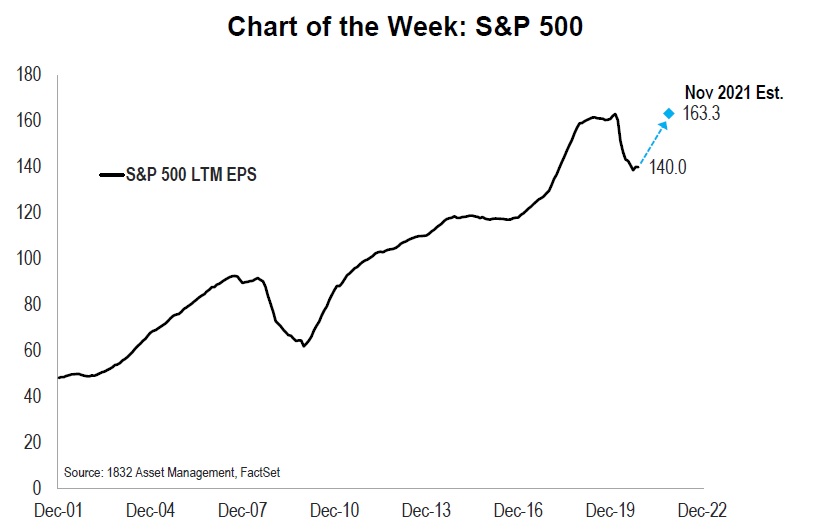
Bottom-up consensus estimates suggested that this quarter would be the trough in aggregate earnings and the strong results certainly helped support that prediction. S&P 500 trailing earnings has fallen 14.3% since peaking in February 2020 and currently stands at $140. If estimates are met over the coming year, the Index should see +16.7% growth and a full recovery by November 2021 (see the chart of the week below).
- The strong start to earnings season reported in our preview a month ago held up to the end with results remaining heavily skewed to the upside. The breadth of beats for earnings and sales are well above average for all capitalization segments. Economic uncertainty around COVID-19 and the lack of management guidance likely caused analysts to set very low targets.
- The magnitude of earnings surprises has also been very strong with double-digit beats for all three indices. The S&P 600 stands out with a stellar +57% surprise.
Earnings Growth Came in Far Above Expectations
- Q3 2020 earnings growth targets were slashed leading up to reporting season and the final results suggest that the analyst community were far too pessimistic. Only single-digit contractions were seen in earnings compared to the staggering double-digit projections.
- A similar story is seen for the top-line as actual sales growth also fell much less than anticipated in Q3.
All S&P 500 Sectors Beat Earnings Growth Projections
- Every major S&P 500 sector surpassed earnings growth expectations in Q3. Five of them, including Health Care, Consumer Staples, Communication Services, Information Technology, and Utilities, posted positive quarterly year-over-year earnings growth.
- Almost the same story was seen for top line (sales) growth, but Materials came in slightly lower than expected. The relative order of growth for sales mirrored that of earnings in Q3 with defensive sectors posting the highest growth rates.
(End of Myles Zyblock commentary)
Weekly Update – By The Numbers
| North America | Friday Close | Weekly Change | Weekly % Change | YTD % Change |
| Canada – S&P TSX Composite | 17,019 | 343 | 2.06% | -0.26% |
| USA – Dow Jones Industrial Average | 29,263 | -217 | -0.74% | 2.54% |
| USA – S&P 500 | 3,558 | -27 | -0.75% | 10.12% |
| USA – NASDAQ | 11,855 | 26 | 0.22% | 32.12% |
| Gold Futures (USD) | $1,869.60 | -$16.10 | -0.85% | 23.00% |
| Crude Oil Futures (USD) | $42.17 | $2.04 | 5.08% | -31.11% |
| CAD/USD Exchange Rate | € 0.7636 | € 0.0023 | 0.30% | -0.83% |
| Europe / Asia | Friday Close | Weekly Change | Weekly % Change | YTD % Change |
| MSCI World Index | 2,540 | 11 | 0.43% | 7.72% |
| Switzerland – Euro Stoxx 50 | 3,468 | 36 | 1.05% | -7.47% |
| England – FTSE 100 | 6,351 | 26 | 0.41% | -15.95% |
| France – CAC 40 | 5,496 | 116 | 2.16% | -8.06% |
| Germany – DAX Performance Index | 13,137 | 60 | 0.46% | -0.85% |
| Japan – Nikkei 225 | 25,527 | 141 | 0.56% | 7.90% |
| China – Shanghai Composite Index | 3,378 | 68 | 2.05% | 10.75% |
| CAD/EURO Exchange Rate | € 0.6436 | -€ 0.0010 | -0.16% | -6.24% |
| Fixed Income | Friday Close | Weekly Change | Weekly % Change | YTD % Change |
| 10-Year Bond Yield (in %) | 0.8290 | -0.0640 | -7.17% | -56.80% |
Source: Yahoo! Finance, CNBC.com, Dynamic Funds
This information is provided for general information purposes only. It does not constitute professional advice. Please contact a professional about your specific needs before taking any action.
The post S&P 500 Q3 Earnings Results appeared first on Smof Investment Manager, LLC.
]]>The post An Update on the U.S. Economy appeared first on Smof Investment Manager, LLC.
]]>U.S. Economy: Q3 GDP and Beyond
The world’s largest economy is in recovery mode. U.S. consumer spending has made an impressive comeback, manufacturing activity has firmed, and the stabilization in international markets is supporting trade. The second-quarter GDP collapse is likely to be followed by a sharp bounce higher, upwards of +25% annualized, when Q3 data is reported later this week.
The economic expansion is expected to stretch into 2021. The gathering momentum across the private sector is being supported by ongoing government stimulus. The combination of excess productive capacity and elevated personal savings rates points to the potential for above-trend economic growth, say close to 4%, over the coming calendar year.
COVID-19 is the wildcard. The key economic risk, in our opinion, is not the upcoming U.S. election. It is how the renewed spread from the coronavirus across many states feeds into behavior over the winter months. At this stage, we do not see it offering enough of a headwind to short-circuit the budding recovery, but it’s something which will require ongoing monitoring.
The Consumer is Making a Comeback
Core retail sales have more than recovered all that was lost during the early days of the pandemic. On a year-over-year basis, retail sales expanded by 9.1% in September which was the fastest pace of growth recorded since this series came into existence in 1993.
The consumer is being helped by an improving labor market. The unemployment rate has dropped to 7.9% from its peak level of 14.7% reached in April. Close to 11.5 million of the 22.1 million jobs initially lost in the pandemic have been restored. While it still has a long way to go, the labor market has made up a significant amount of lost ground over the past few months.
Trade Activity has Started to Mend
Trade was hit hard in the initial stages of the coronavirus pandemic. Exports fell by a whopping 33% and imports declined by 19% from February through to May. Both have started to recover. Firming global end-market demand has lifted exports, which are up by 21% from the May low. Imports have rallied by a respectable 20% since May, buoyed by strengthening domestic demand.
A better tone to trade signifies a recovering global economy and should help further support U.S. corporate earnings given that a growing share, now 21%, of those earnings are sourced from abroad. As a side note, the foreign exposure of S&P 500 earnings is estimated at a much higher 35-40% given that the index is dominated by large multi-national companies.
Government Activity is White Hot
According to the monthly Treasury statement, U.S. federal outlays for fiscal year-to-date have surpassed $3.6 trillion dollars. This represents an increase of about $1.2 trillion over the same period a year ago. This unprecedented spending surge has helped push the Federal Government’s deficit for 2020 to $3.1 trillion, or 16% of GDP. And the year’s not over.
Admittedly, government support has been a critical bridge for the private sector which has suffered staggering job and income losses. At the same time, it is pushing gross federal debt as a % of GDP above 100%, a level which surpasses the debt load carried as a result of WWII.
Wrapping It Up
- The second quarter was one of the weakest quarters for U.S. GDP growth recorded in the past 100 years. However, a new recovery has begun. Growth has resumed for many indicators across the consumer, manufacturing and trade sectors. This is occurring alongside the ongoing support of government policy stimulus.
- Q3 GDP is going to be released on Thursday, October 29th. The economics community expects growth of close to +30% on an annualized basis. GDP growth is likely to remain positive beyond the third quarter, albeit at a much slower pace.
- The key economic risk, in our opinion, is not the upcoming U.S. election. Rather, it is how the renewed spread from the coronavirus feeds through into economic activity. At this stage, we do not see it as offering enough of a headwind to short-circuit the budding recovery.
(End of Myles Zyblock commentary)
New Containment Measures Enacted as Cases Rise, Markets Decline
As case counts continue to rise, new containment measures were announced in the past week in renewed efforts to mitigate the spread of COVID-19:
- The measures announced yesterday remain in line with the base-case scenario, which calls for the use of more targeted restrictions rather than a return to the total lockdown of early 2020.
- The new European measures are similar to those announced by the Quebec government earlier in October: four weeks of closures of restaurants, bars, cinemas, gyms; restrictions on gatherings; while keeping most businesses and schools open. The silver lining is that this approach appears to have had some success in the province as cases have since stabilized.
- Markets are likely to remain hesitant until a date can be put on the arrival of a permanent solution to the pandemic. There is no way to know for sure when that will be, but recent news surrounding vaccine research remains generally positive as evidenced by the increased likelihood of a vaccine being available by the end of Q1-2021.
Weekly Update – By The Numbers
| North America | Friday Close | Weekly Change | Weekly % Change | YTD % Change |
| Canada – S&P TSX Composite | 15,581 | -723 | -4.43% | -8.69% |
| USA – Dow Jones Industrial Average | 26,502 | -1,834 | -6.47% | -7.13% |
| USA – S&P 500 | 3,270 | -195 | -5.63% | 1.21% |
| USA – NASDAQ | 10,912 | -636 | -5.51% | 21.61% |
| Gold Futures (USD) | $1,878.80 | -$24.60 | -1.29% | 23.61% |
| Crude Oil Futures (USD) | $35.72 | -$4.06 | -10.21% | -41.64% |
| CAD/USD Exchange Rate | € 0.7505 | -€ 0.0110 | -1.44% | -2.53% |
| Europe / Asia | Friday Close | Weekly Change | Weekly % Change | YTD % Change |
| MSCI World Index | 2,293 | -138 | -5.68% | -2.76% |
| Switzerland – Euro Stoxx 50 | 2,958 | -241 | -7.53% | -21.08% |
| England – FTSE 100 | 5,577 | -283 | -4.83% | -26.19% |
| France – CAC 40 | 4,594 | -316 | -6.44% | -23.15% |
| Germany – DAX Performance Index | 11,556 | -1,090 | -8.62% | -12.78% |
| Japan – Nikkei 225 | 22,977 | -540 | -2.30% | -2.87% |
| China – Shanghai Composite Index | 3,225 | -53 | -1.62% | 5.74% |
| CAD/EURO Exchange Rate | € 0.6441 | € 0.0018 | 0.28% | -6.16% |
| Fixed Income | Friday Close | Weekly Change | Weekly % Change | YTD % Change |
| 10-Year Bond Yield (in %) | 0.8600 | 0.0190 | 2.26% | -55.18% |
Source: Yahoo! Finance, CNBC.com, National Bank Investments, Dynamic Funds
This information is provided for general information purposes only. It does not constitute professional advice. Please contact a professional about your specific needs before taking any action.
The post An Update on the U.S. Economy appeared first on Smof Investment Manager, LLC.
]]>