The post 20 Charts for 2020 appeared first on Smof Investment Manager, LLC.
]]>Further downside risks include the U.S. elections, global trade tensions, aging demographics, and technological disruption.
However, no two economic cycles follow the exact same path. For example, despite weaker corporate earnings, global equity markets showed renewed strength last year, and with several central banks cutting rates in recent months to encourage business activity, this may be a longer than usual “late-stage”.
We compiled 20 charts that summarize the economic and financial picture for 2019 and 2020:
1: 2019 Equity returns were strong, more than recovering from the 2018 pullback
After a turbulent finish in 2018, markets rebounded across the board in 2019 to end the decade on a strong note. Here are the 1, 5, and 10 year returns for the major indexes: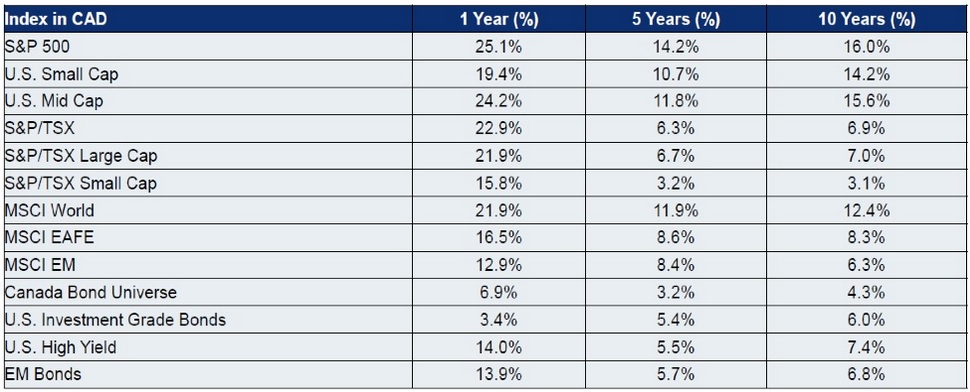
2 & 3: TSX (Canadian Market) and S&P 500 (U.S. Market) sector returns
Last year, the top-performing Canadian sectors were Information Technology, Utilities, Industrials, Materials and Financials. Overall, returns for the 11 S&P/TSX sectors were strong, except for Health Care. This sector declined 10.9%, led by the “return to earth” performance of many of the previous year’s “high-flying” cannabis stocks. One of the common themes across the best-performing sectors was the market favouring stocks that look like bonds (high-yielding sectors such as Utilities and Financials). 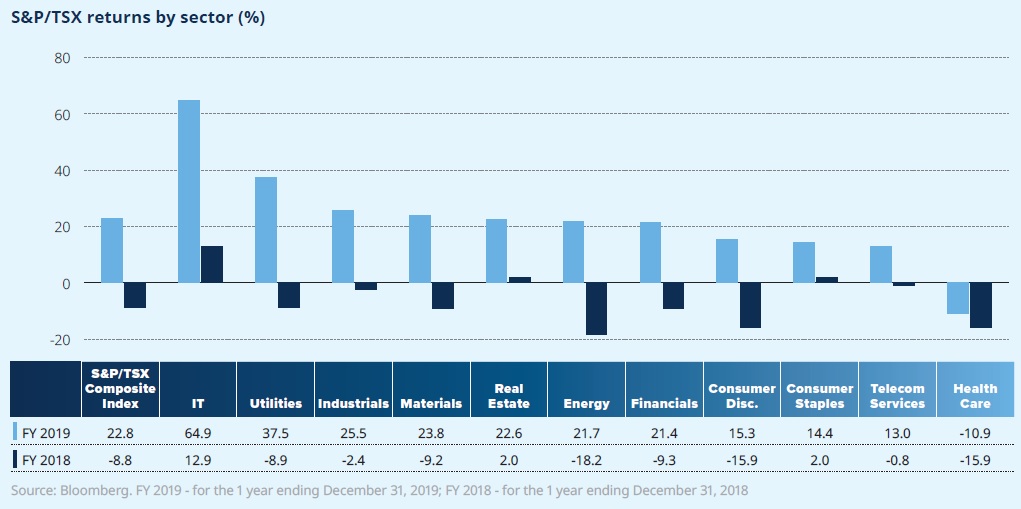
For the S&P 500, the strongest returns in 2019 were in the Information Technology, Utilities, Industrials, Materials and Financials sectors. The wide gap (75% for the TSX and 40% for the S&P 500) between the best and worst performing sector makes a strong case for diversification. 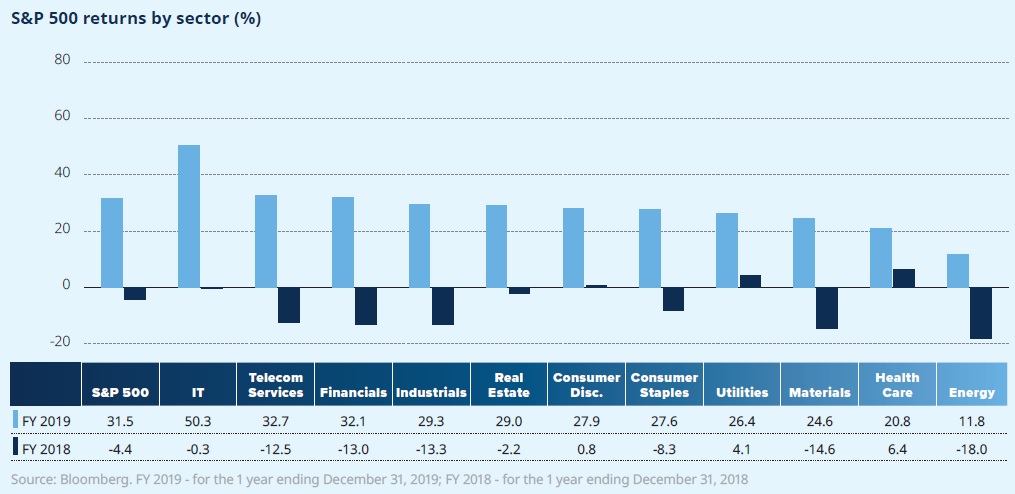
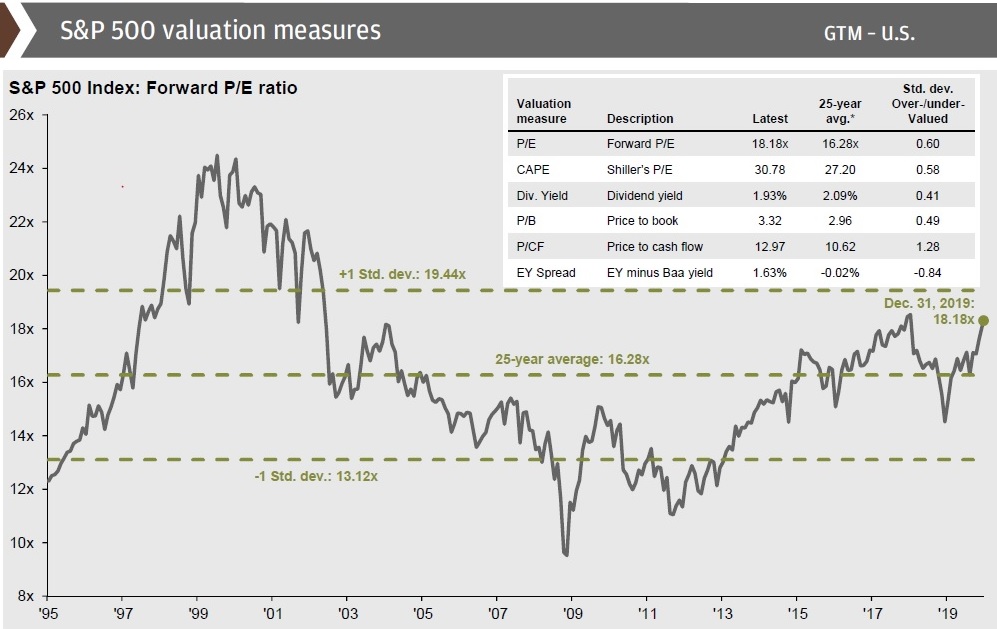
4: U.S. equity valuations to end 2019 were slightly above the historical average
The chart below tracks various valuations methods for the S&P 500. You can read more about the P/E ratio and expected market returns in Anthony’s article, New Decade, New Expecations.
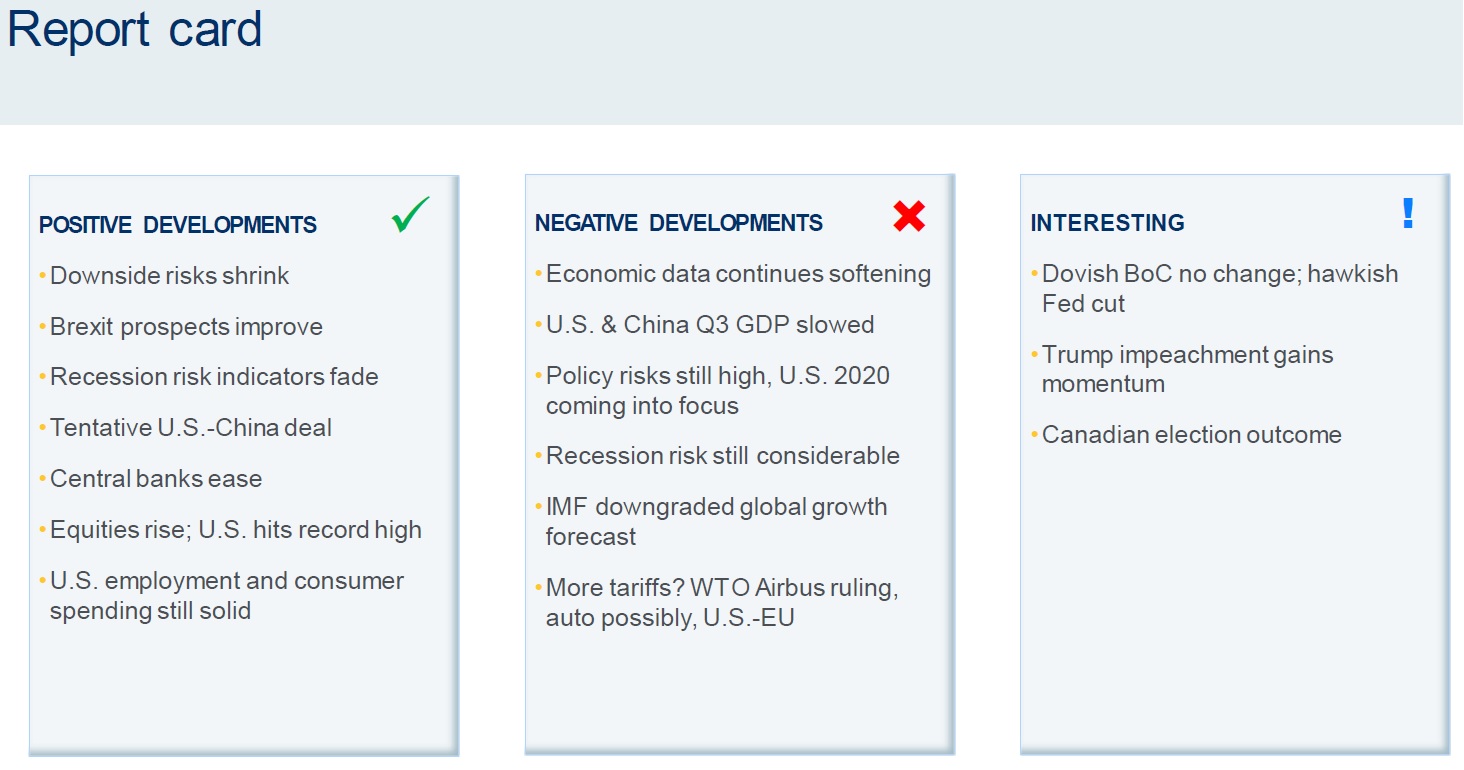
5: Economic Report Card
From RBC Global Asset Management (RBC GAM), here is an overview of recent positive and negative developments as 2019 wound down, as well as some “interesting” items that may end up in positive or negative territory when the dust settles.
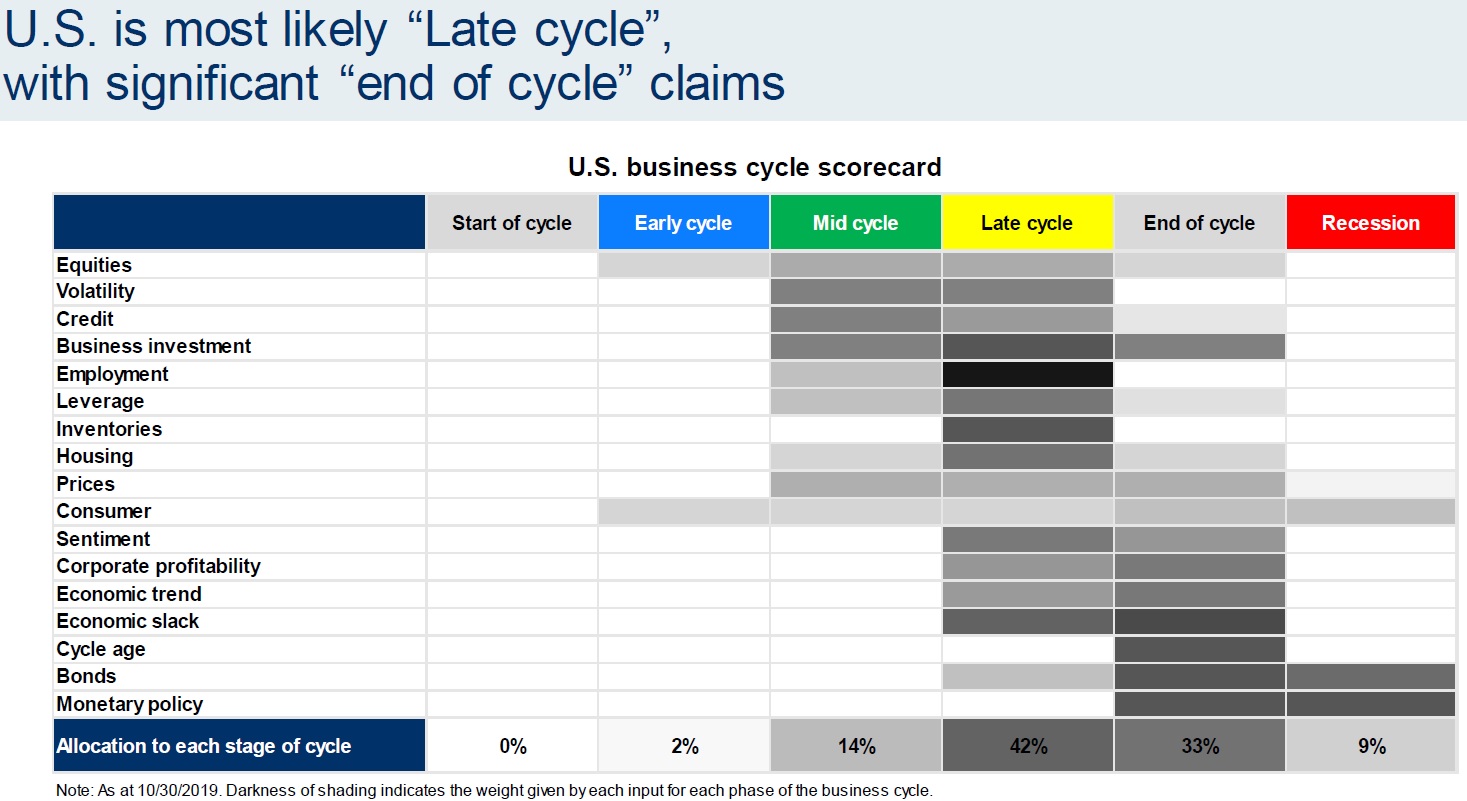
6 & 7: Most countries are exhibiting late–stage market signals
Another chart from RBC GAM. A gauge of various economic metrics suggest the U.S. is most likely in a “late cycle” phase.
Fidelity’s chart below presents a similar case. Most countries are firmly in-between the expansion and contraction phases. 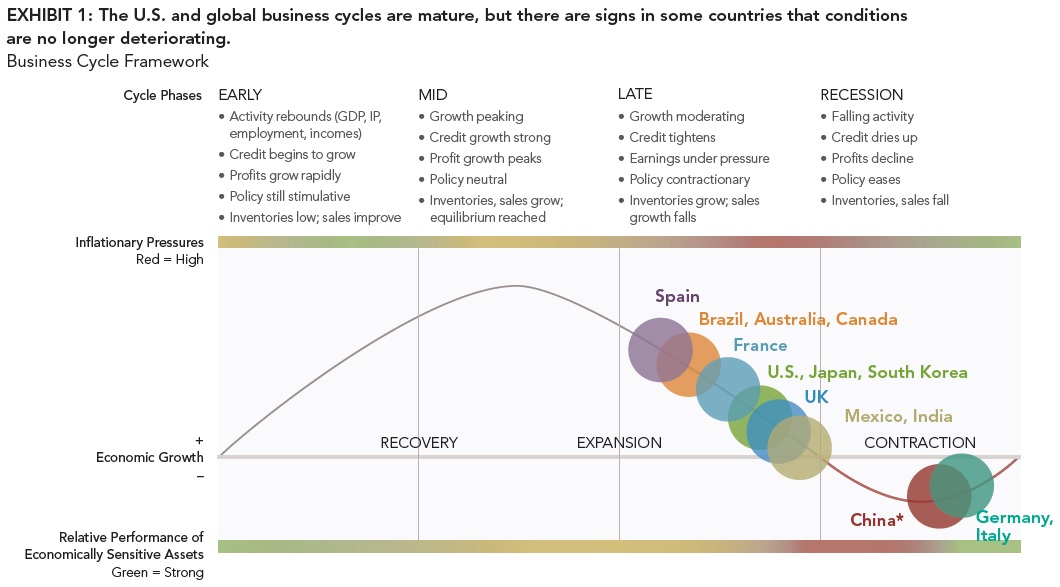
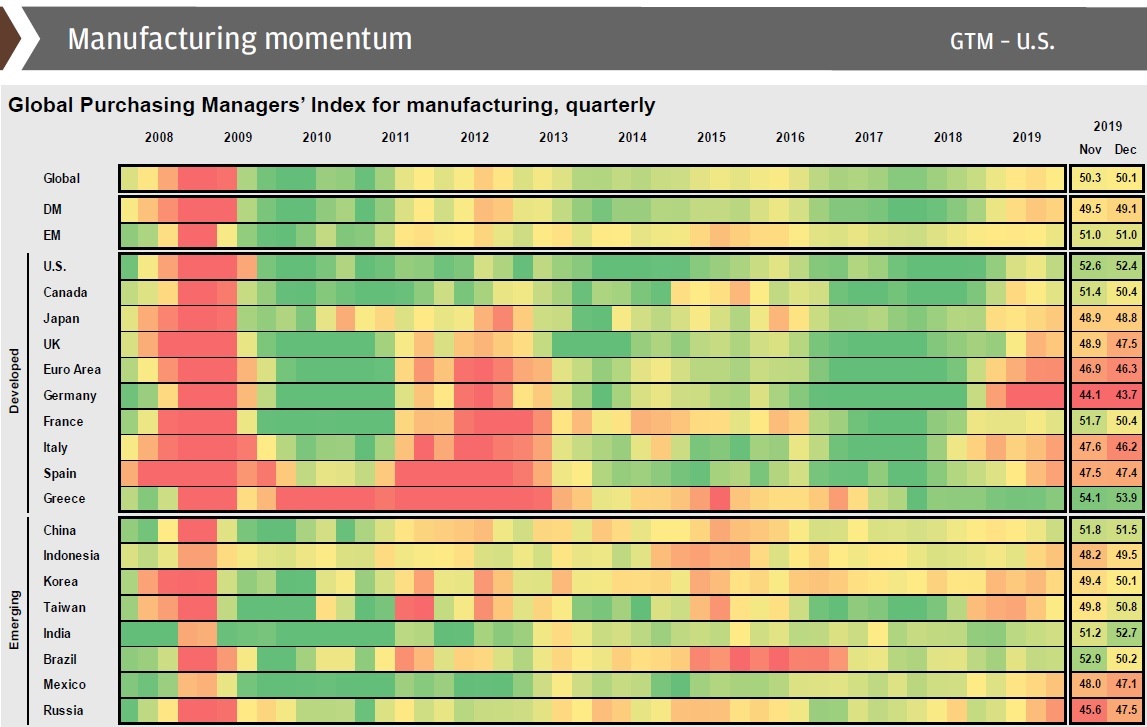
8 & 9: Global GDP growth slowed as expected in 2019
Last year, we speculated a reversion to about 2.0% in 2019 was a likely outcome. Actual Q3 year-over-year growth was 2.1%. Looking to 2020, the U.S. economy could see a bump if any of the economic headwinds (for instance, the U.S.-China trade dispute) were removed, with additional Quantitative Easing (QE) or with a continued “lower for longer” rate strategy at the Fed.
The Purchasing Manager’s Index (PMI – measure of manufacturing strength) data shows that only a handful of global economies continue to operate in expansion mode.
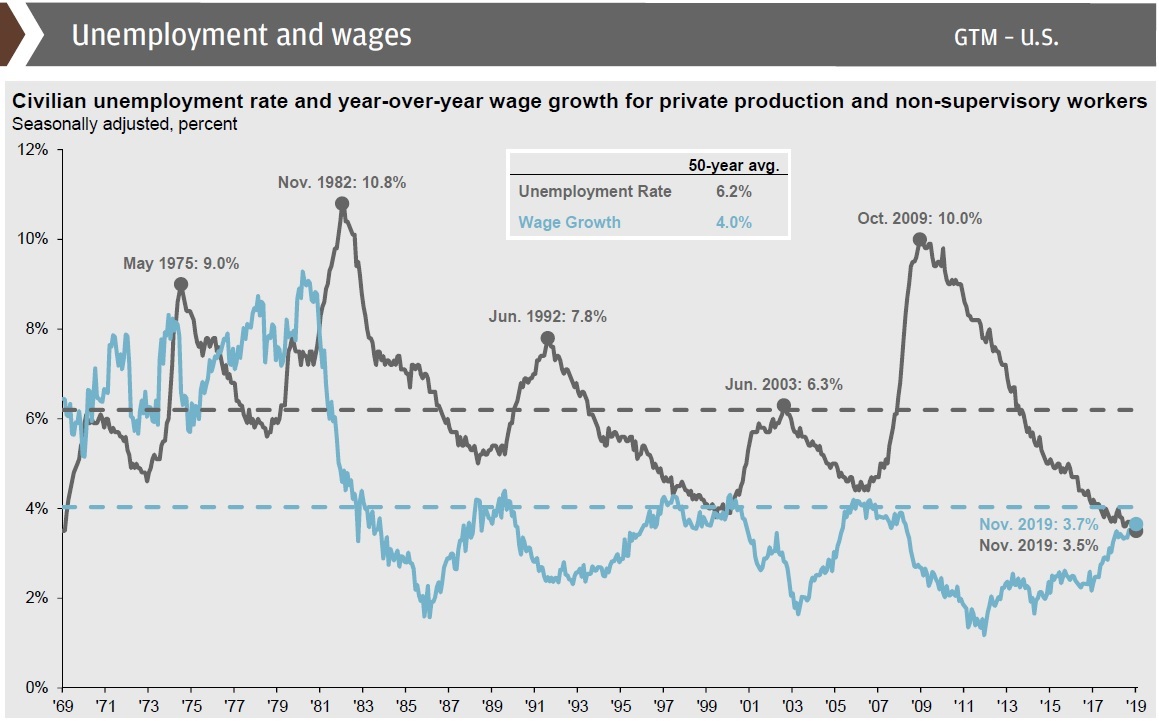
10: U.S. unemployment hit lowest level since the late-60s
Unemployment hit a 50-year low in 2019. Persistent factors limiting labour force growth (baby boomers retiring, tight immigration policy, etc.) remain. Wage growth also ticked upward from 3.2% in November 2018 to 3.7% in November 2019.
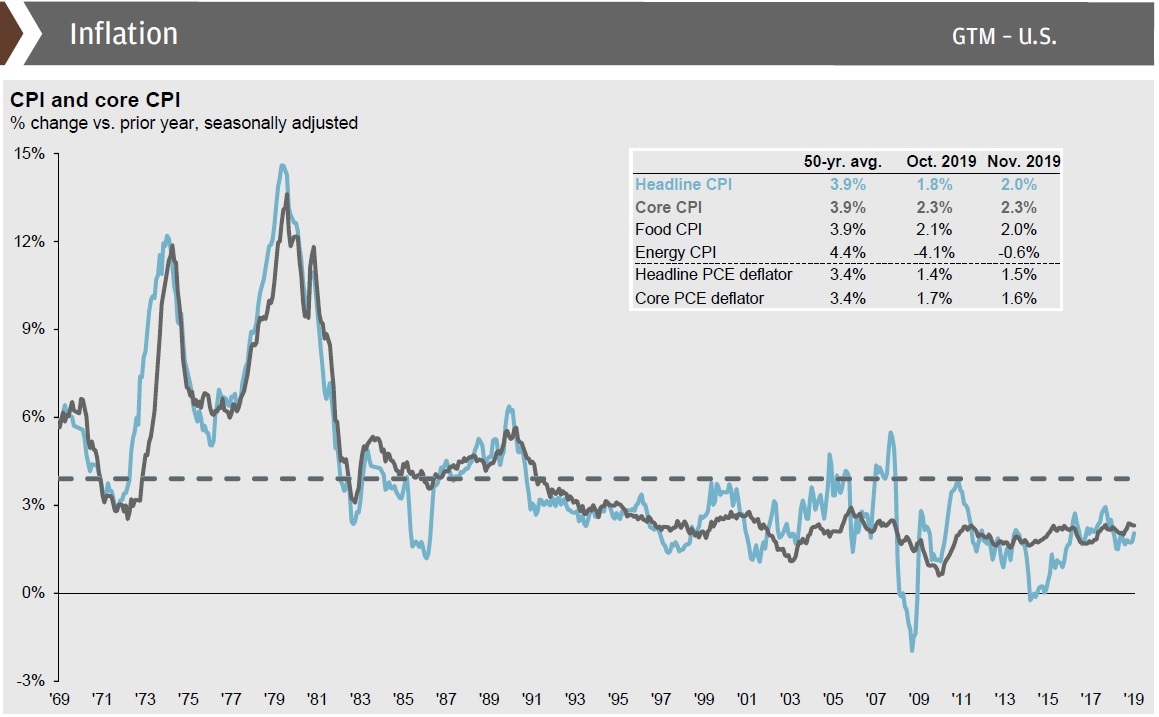
11: Inflation was stable 2019, but expect an uptick in 2020
U.S. inflation, measured by the personal consumption deflator, dropped from 2018 levels (1.9%) and sat at 1.6% as of November 2019. Rising wages and lowering unemployment have not impacted inflation as one might expect. The U.S. Federal Reserve (the Fed) will likely continue its “lower for longer” rate strategy to stimulate inflation up toward the Fed’s 2.0% target.
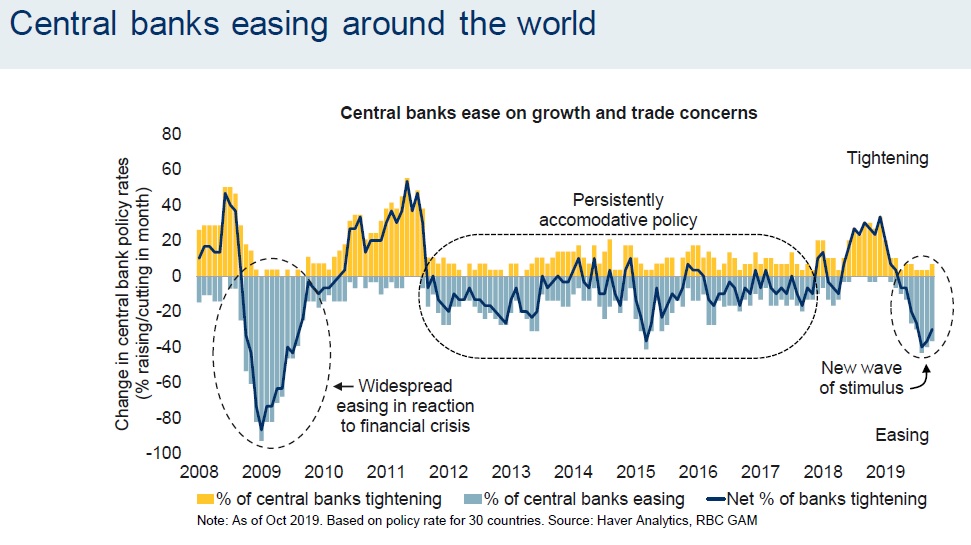
12: U.S. Central Bank changes course, lowering key rate
After slowly raising rates the last few years, the Fed and other central banks around the world made an abrupt 180 in 2019 and cut their key rates. Global Central Bank activity could be described as “over-reactionary” in 2018, as tightening effects helped lead markets downward to end the year. 2019 saw a reverse, with nearly 40% of central banks easing throughout 2019.
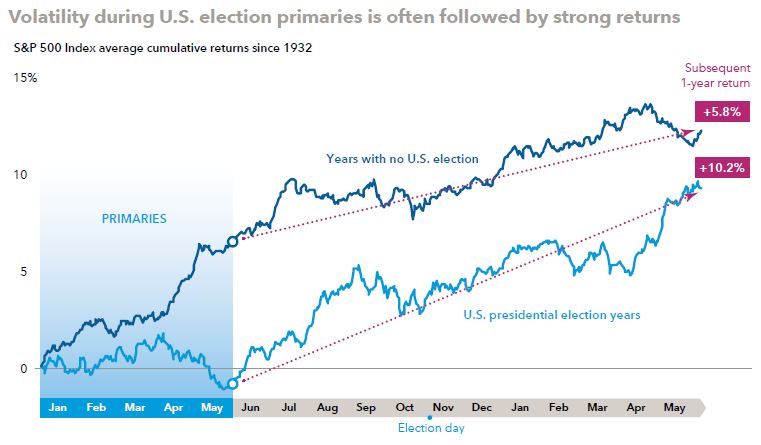
13: Volatility during U.S. election primaries is often followed by strong returns
Historically speaking, whether a Democrat or Republican is elected President has had little bearing on market results. However, investors who chose to ride out the volatility experienced during primary season tend to be rewarded in the following 12 months.
14: Brexit will hurt the United Kingdom’s GDP…
Note that this chart was as of October 31, 2019. As expected, Boris Johnson was elected Prime Minister of the United Kingdom. The most likeliest Brexit outcome is Johnson’s “Soft” Brexit*, which would still negatively impact the U.K.’s GDP. However, this outcome would still be superior to the “Middling” or the “Hard” Brexit scenarios.
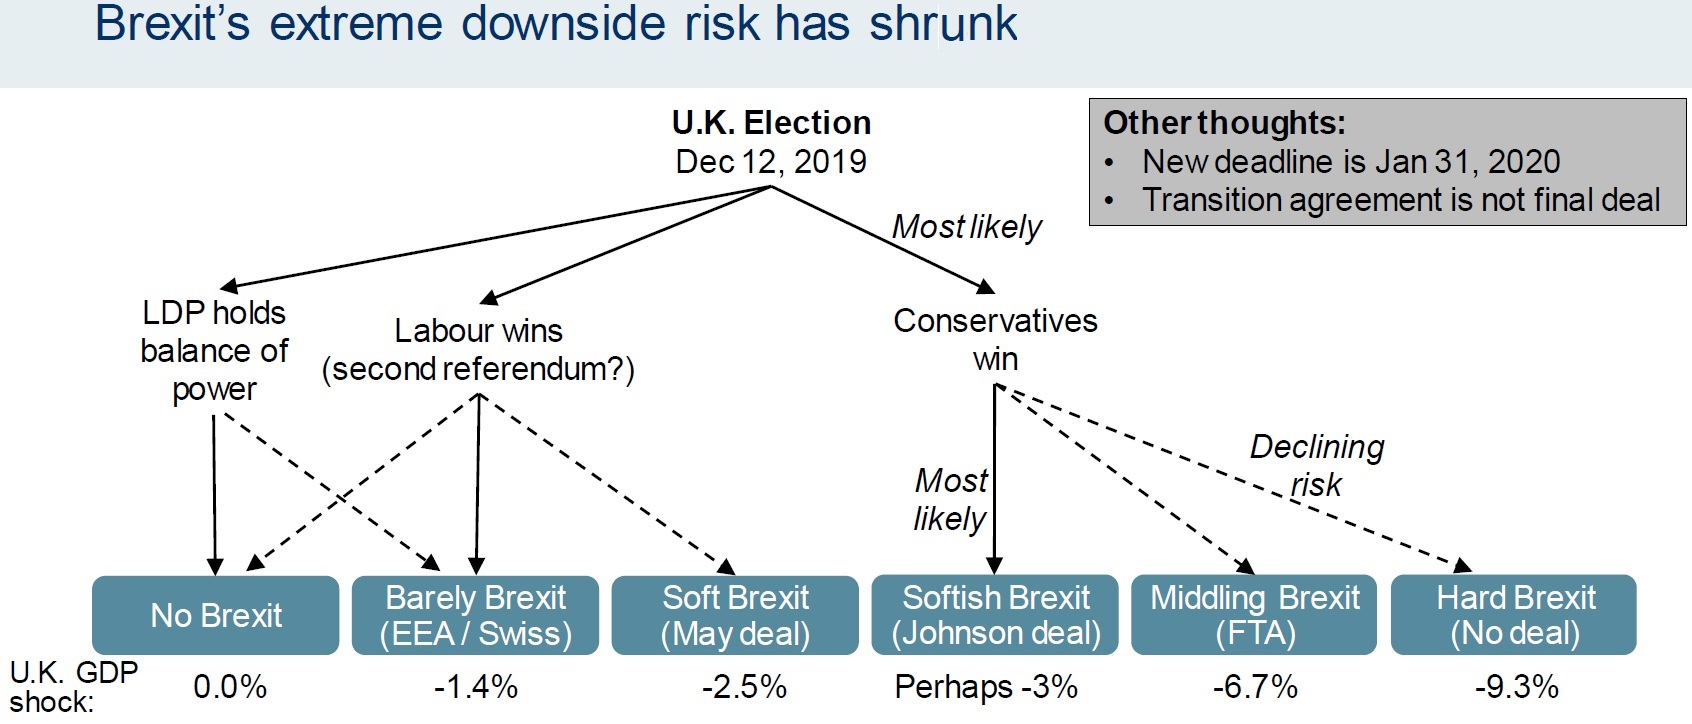
*Editor’s Note: This week, parliament voted Boris Johnson’s “Withdrawal Agreement Act” into U.K. law. The U.K. is now set to leave the European Economic Union on January 31st.
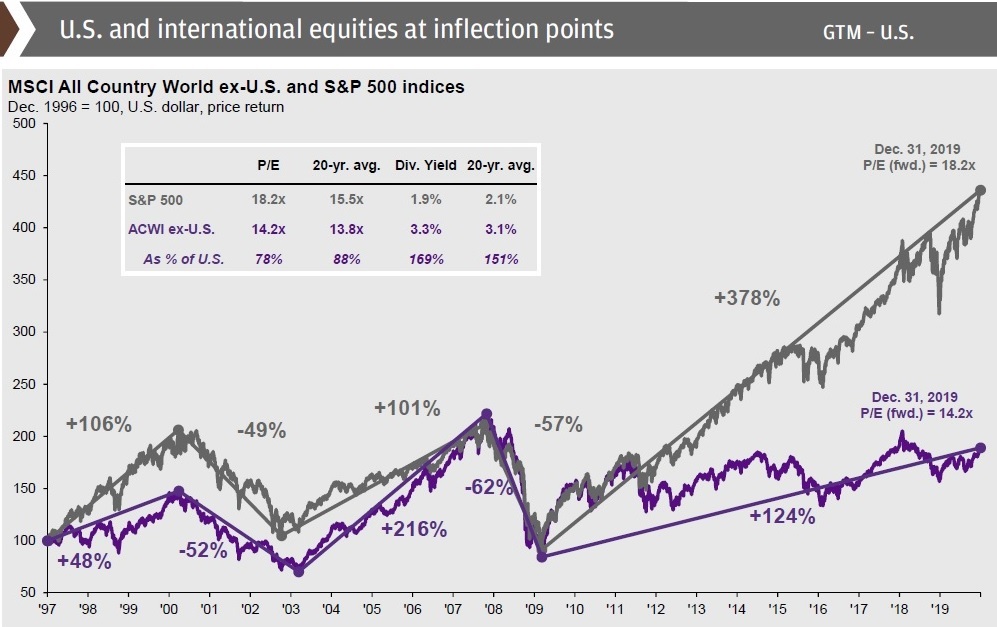
15: …But international equities continue to offer long-term opportunities
Structural issues in Europe have resulted in lower valuations for European equities relative to the U.S. Historically, the U.S. and Europe have had alternating periods of outperformance.
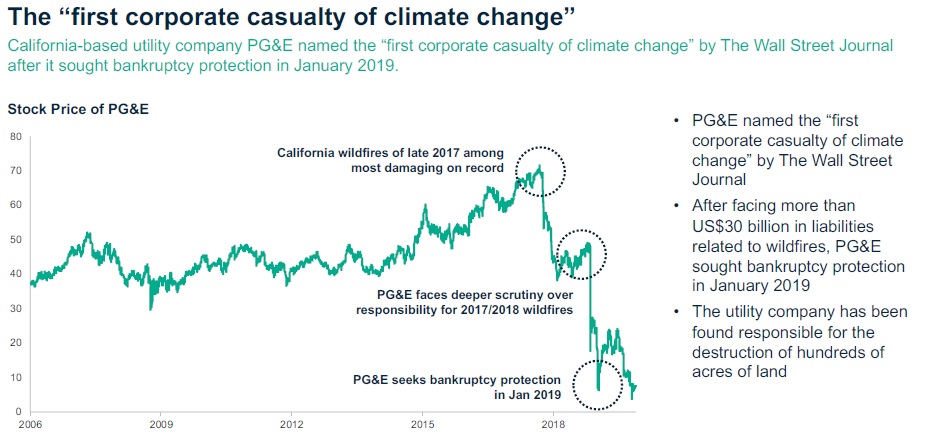
16: Climate change’s first “corporate casualty”
2018 saw California wildfires run out of control, culminating with the so-called “Camp Fire” which caused ≈ $7 Billion in property damages, including the complete destruction of over 14,000 homes in November. Lawsuits ensued. The Pacific Gas & Electric Corporation (PG&E), under extreme financial duress due to the incoming lawsuits, filed for Chapter 11 Bankruptcy protection on January 29, 2019. PG&E is now widely cited as the first corporate casualty of climate change.
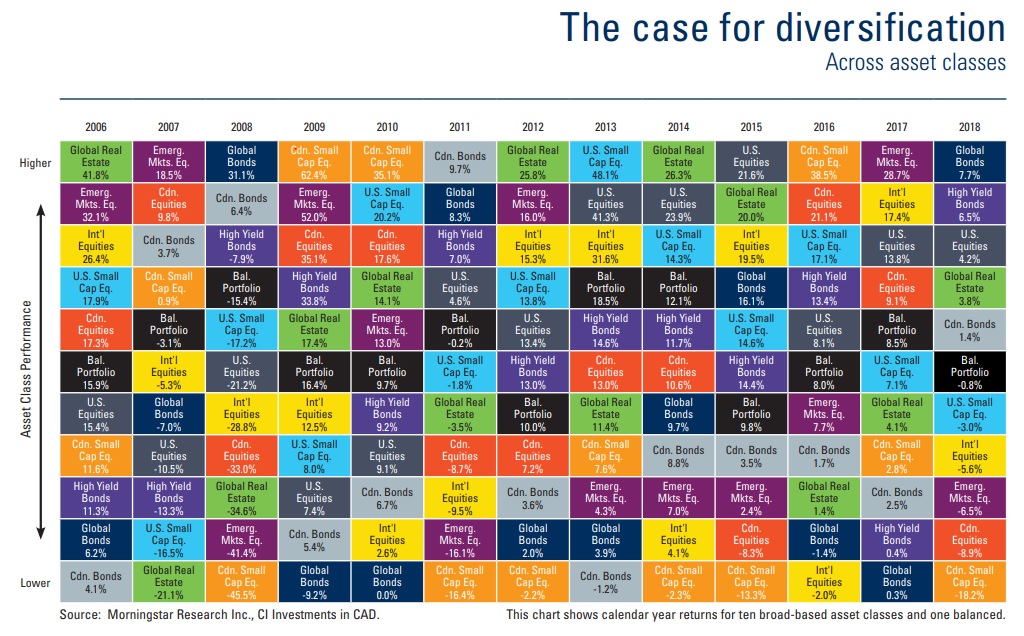
17: Broad diversification is a great risk-mitigator
2019 returns exceeded most analysts’ expectations and there is reason to be cautiously optimistic as we look ahead to 2020. With valuations for many assets near record highs, a well-diversified investment portfolio can help to maximize returns and mitigate risks as they occur.
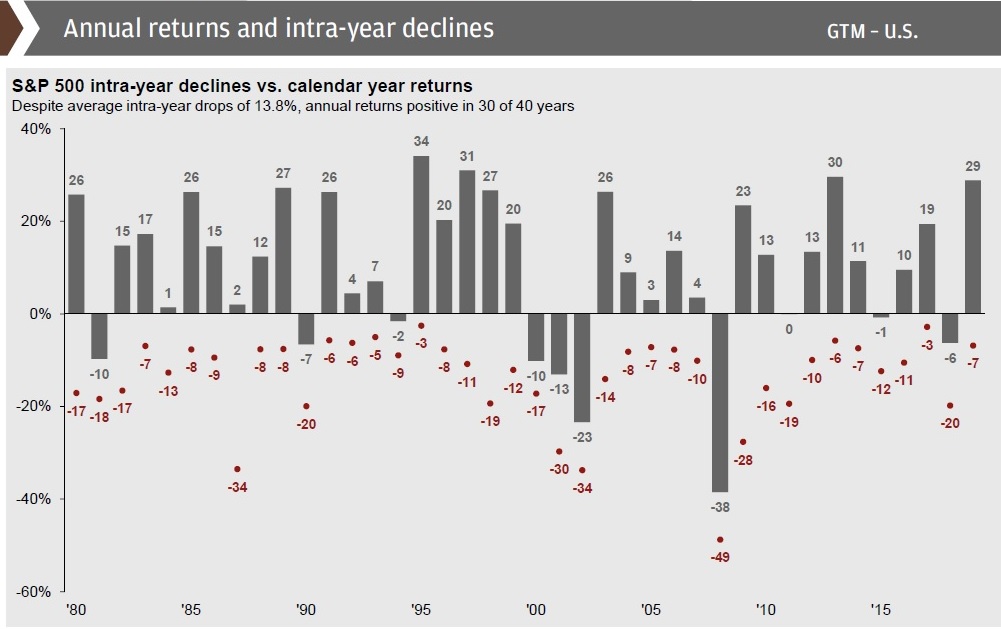
18: Intra-year declines happen every year, don’t panic!
History has shown that a large majority of calendar years see at least one market pullback of 5% or more. Last year was a perfect example of this, with the S&P 500 finishing up 29%, but declining 7% in May. It is generally a good idea to ride out the volatility, as markets always rebound over time.
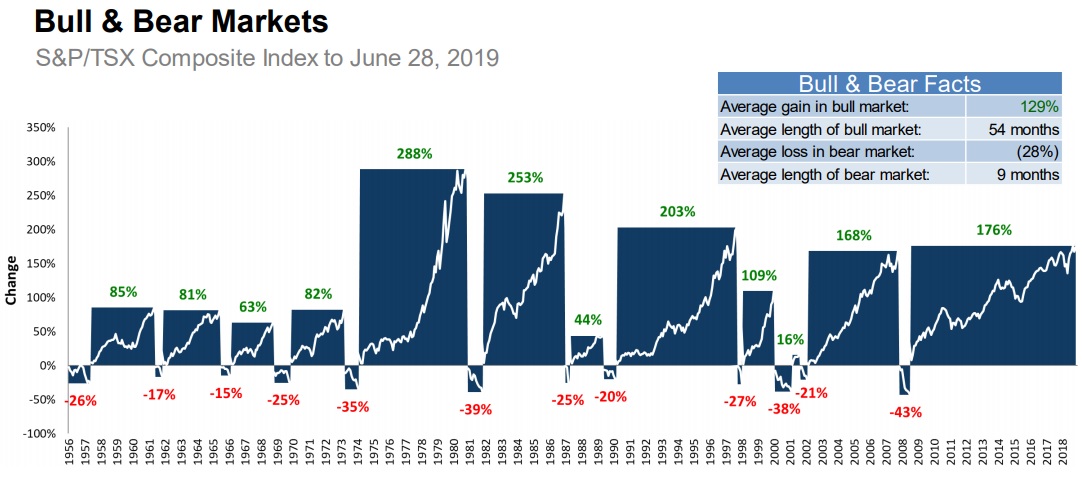
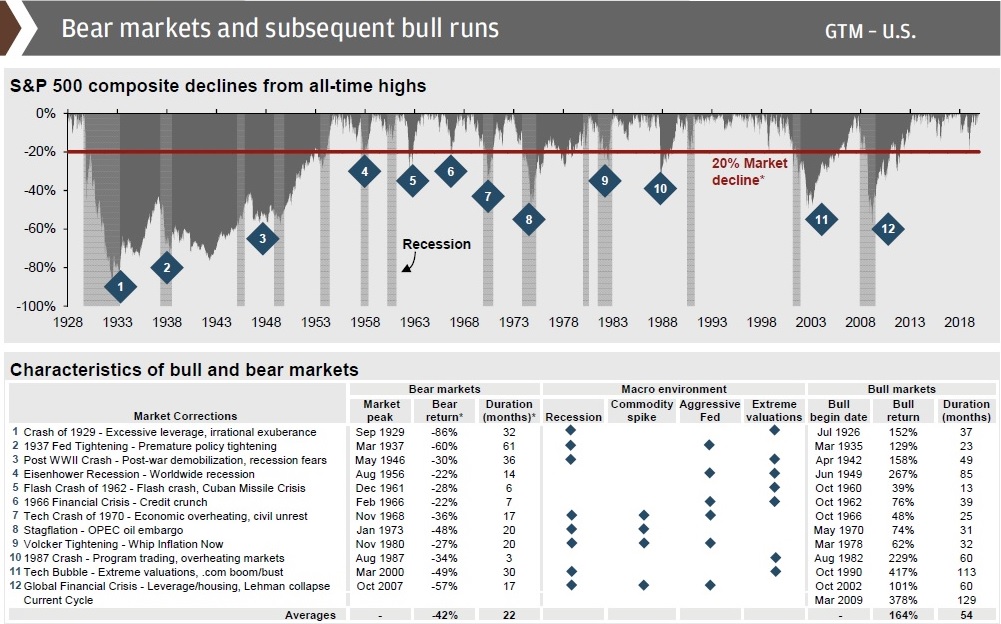
19 & 20: Bull (rising) markets are longer and stronger and last longer than bear (declining) markets
Going back to the mid-1950s, the average bull market gain has seen the TSX gain 129% with an average length of 54 months, while the average bear market sees the TSX drop by 28% while lasting only 9 months. As we can see, bull markets last longer and more than make up for their preceding bears.
Using data going back to The Great Depression, we see that the average S&P 500 bull market is also 54 months and the average total return is 164%, whereas the average bear market lasts 22 months but sees a 42% drop. Once again, the average bull market lasts longer and gains more than the preceding bear market lasts & drops.
Sources: Capital Group, Fidelity, JP Morgan, RBC GAM, NEI Investments, Mackenzie, Forbes.com, CI Investments, Sky News
This information is provided for general information purposes only. It does not constitute professional advice. Please contact a professional about your specific needs before taking any action.
The post 20 Charts for 2020 appeared first on Smof Investment Manager, LLC.
]]>The post Weekly Update – January 17, 2020 appeared first on Smof Investment Manager, LLC.
]]>Markets Move Upward on “Phase One” Trade Deal Announcement
This week, the United States and China came to an agreement on the first portion of a trade deal between the two nations. The so-called “Phase One” deal lays the groundwork to begin work toward the “Phase Two” deal. While the announcement of the Phase One agreement is positive, it should be noted that more heavy lifting is required as the trade war is not yet over. It is still possible that Phase Two will not be completed prior to the U.S. Presidential Election this coming November.
The Phase Two talks are expected to be centered around more contentious subjects, such as Chinese structural economic reform.
Markets reacted positively to news of the agreement. The Dow Jones Industrial Average is within striking distance of the 30,000 mark, which would be the first time 30,000 has been hit by the Dow. The S&P 500 and Nasdaq also rose on the news. The New York S&P/TSX Composite, most of Western Europe, and Japan, to name a few worldwide indexes, were also positive movers.
Weekly Update – By The Numbers
| North America | Friday Close | Weekly Change | Weekly % Change | YTD % Change |
| Canada – S&P TSX Composite | 17,559 | 325 | 1.89% | 2.91% |
| USA – Dow Jones Industrial Average | 29,348 | 524 | 1.82% | 2.84% |
| USA – S&P 500 | 3,330 | 65 | 1.99% | 3.06% |
| USA – NASDAQ | 9,389 | 210 | 2.29% | 4.64% |
| Gold Futures (USD) | $1,556.70 | -$5.30 | -0.34% | 2.41% |
| Crude Oil Futures (USD) | $58.72 | -$0.42 | -0.71% | -4.07% |
| CAD/USD Exchange Rate | € 0.7649 | -€ 0.0005 | -0.07% | -0.66% |
| Europe / Asia | Friday Close | Weekly Change | Weekly % Change | YTD % Change |
| MSCI World Index | 2,416 | 38 | 1.60% | 2.46% |
| Switzerland – Euro Stoxx 50 | 3,808 | 18 | 0.47% | 1.60% |
| England – FTSE 100 | 7,675 | 87 | 1.15% | 1.57% |
| France – CAC 40 | 6,101 | 64 | 1.06% | 2.06% |
| Germany – DAX Performance Index | 13,526 | 43 | 0.32% | 2.09% |
| Japan – Nikkei 225 | 24,041 | 190 | 0.80% | 1.62% |
| China – Shanghai Composite Index | 3,076 | -16 | -0.52% | 0.85% |
| CAD/EURO Exchange Rate | € 0.6895 | € 0.0011 | 0.16% | 0.45% |
| Fixed Income | Friday Close | Weekly Change | Weekly % Change | YTD % Change |
| 10-Year Bond Yield (in %) | 1.8360 | 0.0110 | 0.60% | -4.33% |
Sources: Dynamic, Yahoo Finance, CNBC.com, Advisor.ca
This information is provided for general information purposes only. It does not constitute professional advice. Please contact a professional about your specific needs before taking any action.
The post Weekly Update – January 17, 2020 appeared first on Smof Investment Manager, LLC.
]]>The post Our September 2019 E-Newsletter Is Here! appeared first on Smof Investment Manager, LLC.
]]>Here is where markets stand for 2019 (year-to-date return as of August 30. Foreign market returns are expressed in Canadian dollar terms):
–TSX (Canada): 14.8%
–DOW Jones (U.S.): 10.5%
–S&P 500 (U.S.): 13.9%
–FTSE 100 (UK): -0.4%
–DAX (Germany): 7.5%
–MSCI EAFE (Europe and Asia markets): 4.6%
–MSCI World (Aggregate of all global markets): 10.8%
–TMX Canadian Universe Bond: 8.7%
Following last fall’s decline, stock markets experienced a v-shaped recovery from January to June 2019. The ‘Powell pivot’ (the U.S. Federal Reserve Chairman’s change in approach to monetary policy) and hopes of more Chinese fiscal and monetary stimulus and the end of the trade war were the primary reasons behind the recovery.
U.S. indices continue to hover near all-time highs despite the uncertainty created by the U.S.-China trade dispute, growing trade protectionism, Brexit, the weakening euro zone, and other macro and geopolitical risks. Although the U.S. economy remains stable, there are signs of the global economy slowing and corporate earnings growth trends continue to decline.
We generally do not recommend any attempts to time the market by making drastic portfolio changes. However, there are tactical moves investors can make to position their portfolio more defensively while maintaining their overall asset mix, if their situation calls for it. For example, those who plan on retiring or drawing heavily from their portfolio in the next few years should reposition their portfolio accordingly.
If you are behind on your financial news, here are a few links to get you caught up:
Smof Investment Articles
Yield Curve Inversion and 800-Point DOW Drop
Other Useful Articles
Will a trade war push the U.S. economy into a recession?
Defensive investing has paid dividends in down markets
We hope you find our September newsletter articles useful. As usual, everyone’s situation is unique and there is no single solution for everyone. If you have questions or concerns about your investments, please feel free to contact us.
This information is provided for general information purposes only. It does not constitute professional advice. Please contact a professional about your specific needs before taking any action.
The post Our September 2019 E-Newsletter Is Here! appeared first on Smof Investment Manager, LLC.
]]>The post Weekly Update – August 23, 2019 appeared first on Smof Investment Manager, LLC.
]]>Trump Tweetstorm – Following New Chinese Tariffs on Imported US Goods – Pushes Markets Lower to End Week
Investors flocked to safe-haven assets on Friday following President Trump’s tweetstorm in response to the Chinese Commerce Ministry’s decision to impose 5% – 10% tariffs, or roughly $75 Billion, in import tariffs on US-made products, starting September 1st. These tariffs will target soybeans, coffee, oil, seafood and whiskey.
Additionally, beginning December 15th, tariffs on imports of US automobiles (25%) and parts (5%) will resume.
President Trump responded, as usual, via tweet, to say “American companies are hereby ordered to immediately start looking for an alternative to China”. It should be noted that the President’s statement here is not binding, and companies are not required to adhere to his “order”.
Trump next tweeted that the Fed can “show their stuff”, and soon after that tweet, attacked Fed Chair Jerome Powell, tweeting “My only question is, who is our bigger enemy, Jay Powell or Chairman Xi?”.
Next, Trump tweeted that he will respond to the new Chinese tariffs accordingly.
In response to Trump’s series of tweets, markets almost instantly dropped across the board. The Dow Jones Industrial Average (DJIA) fell by 2.37% (622.19 points) to finish at 25,630.05, the Nasdaq dropped 3% (239.62 points) to finish at 7,751.77, and the S&P 500 dropped 75.7 points (2.59%) to close at 2,847.25. The S&P/TSX New York Exchange shed 215.88 points (1.33%) to close at 16,037.58.
After markets closed, Trump announced, again via Twitter, an increase on imported Chinese products from a 25% tariff (roughly $250 Billion) to a 30% tariff, taking effect October 1st. Lastly, he increased the tariff measures taking place on September 1st from 10% (roughly $300 Billion) to 15%.
It is worth reiterating that it is not countries who pay these tariffs; rather, it is the end users. Costs are always passed on to the customer. Thus, tariffs will drive inflation upward over time.
What Does This All Mean?
As we wrote about extensively recently in our Mid-Year Outlook, continuing trade tensions could push long-term bond yields downward and lead to an inverted yield curve. If an inverted curve persists for a couple of months, the risk of a recession could become more crystalized.
The US Fed’s 10-Year Minus 2-Year Curve has briefly inverted a couple of times now in the past 2 weeks and is currently at a razor-thin margin of 0.01%, as you can see in the chart below: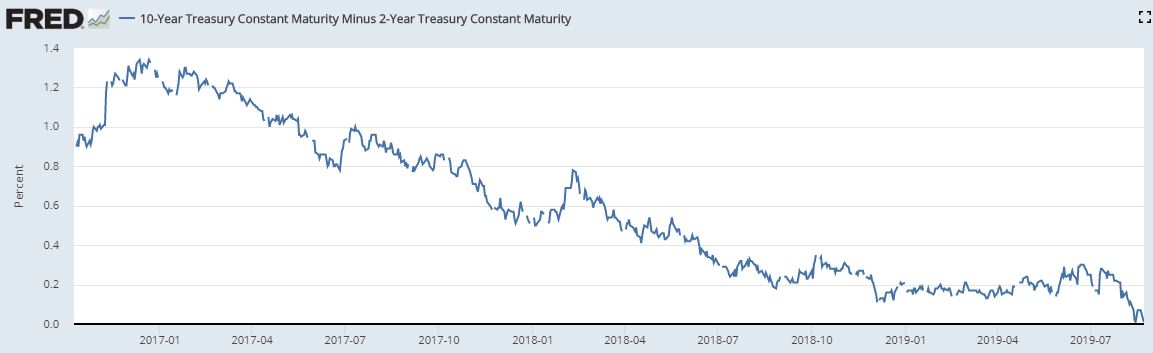
What Should I Do?
In our 2019 Mid-Year Outlook, we outlined a few key strategies to deal with volatile markets – many of which you will have already undertaken:
- Update Your Equity Portfolio – more growth-oriented equities (for example, technology companies) have different properties from defensive, dividend-paying equities (for example, banks). The more growth-oriented the company, the more exposed to market volatility. Thus, re-balancing the equities sleeve of your portfolio to include some defensive holdings is prudent.
- Keep Your Emotions In Check – investor psychology can lead to poor decisions in times of market volatility. Risk aversion (in this case, the bias of loss aversion) can lead people to cash out entirely. This attempt to time markets may “feel” like the right move; however, history has shown us that staying the course over the long term has proven to be the superior strategy.
- Ignore Market Forecasts – the ability to predict future market movements, be it equities or fixed income, is very, very difficult to successfully accomplish on a consistent basis. We do not have a crystal ball to rely upon, so we believe in the time-tested strategy of setting a long-term allocation, weathering pullbacks and investing in quality companies.
Sources: Globe Advisor, CNN Business
This information is provided for general information purposes only. It does not constitute professional advice. Please contact a professional about your specific needs before taking any action.
The post Weekly Update – August 23, 2019 appeared first on Smof Investment Manager, LLC.
]]>The post Weekly Update – August 9, 2019 appeared first on Smof Investment Manager, LLC.
]]>U.S. / China Trade Tensions Update
Though most of Canada took time to relax and celebrate the Civic long weekend, the U.S. and China missed the memo. Both sides have taken steps to escalate their ongoing trade dispute over the course of the past five days, and markets have become more volatile as a result. While Canadian markets were closed on Monday, major indexes in the U.S. fell close to 3%.
U.S. Actions
Things kicked off last Thursday (August 1st) as U.S. President Donald Trump took to Twitter for a surprise announcement. In a four-part thread, Trump announced new, 10% tariffs on $300 billion of Chinese imports not previously targeted. This came the day after Fed Chairman Jerome Powell cited trade tensions in justifying last week’s rate cut by the U.S. Federal Reserve.
China Retaliates
The Chinese government was quick to respond with two separate measures:
- A request for Chinese state-owned companies to suspend imports of U.S. agricultural products – a politically sensitive target for Trump ahead of the 2020 election.
- Allowing the yuan-U.S. dollar exchange rate to fall below the symbolic 7 to 1 level. Last night, the U.S. Treasury reacted to this move by declaring China a currency manipulator – a claim the People’s Bank of China abruptly rejected.
Implications of a Weaker Yuan
A cheaper yuan reduces the cost of Chinese exports in the U.S. – offsetting a portion of U.S. tariffs. As such, it indicates China is looking to provide a buffer against the escalating trade war.
However, the manoeuvre comes with some risks for China. A devaluation back in 2015 resulted in significant capital outflows from the country, and a weaker yuan also puts pressure on Chinese borrowers who will face a less favourable exchange rate when repaying foreign-denominated debt.
Economic Perspectives
In his primer on protectionism, RBC Global Asset Management Chief Economist Eric Lascelles outlines that recessions are rarely triggered by protectionism alone. The economic damage is often mitigated by several factors:
- Businesses seek to maximize profits. They will continue to import products subject to pricey tariffs if they can’t find an alternative way forward.
- Tariff waivers. If U.S. businesses can’t find a suitable domestic supplier, they may qualify for a tariff waiver – 80,000 of which have been submitted regarding steel and aluminum tariffs alone.
- Governments assist affected industries. The U.S. has directed billions to assist its agricultural sector.
Stock Market Perspectives
In the context of recent developments, it is important to note that markets have performed very well so far this year. Even after Monday’s sell-off, the S&P 500 remains up more than 13% in 2019.
For its part, the stock market usually responds to new economic uncertainties with increased volatility in the short term. If you think back to December, similar uncertainty related to trade between the U.S. and China also rattled markets for a few weeks, including a decline of close to 3% on Christmas Eve before resuming an upward trend.
So, over the coming days and weeks it would be normal to expect more ups-and-downs as the market digests new information, especially while both sides in the current trade dispute remain entrenched,
Conclusion
While the short-term will likely see continued ups-and-downs in the market, long-term focused investments need not be overly concerned; as for shorter-term investments, these tend to be (should be) more conservatively allocated and as such, have less exposure to equities.
As always, we stand ready to answer any questions you may have about your portfolio, so don’t hesitate to contact us.
Sources: RBC GAM
This information is provided for general information purposes only. It does not constitute professional advice. Please contact a professional about your specific needs before taking any action.
The post Weekly Update – August 9, 2019 appeared first on Smof Investment Manager, LLC.
]]>